

Strong uptrend in focus: Can SU hold support at C$93.63?

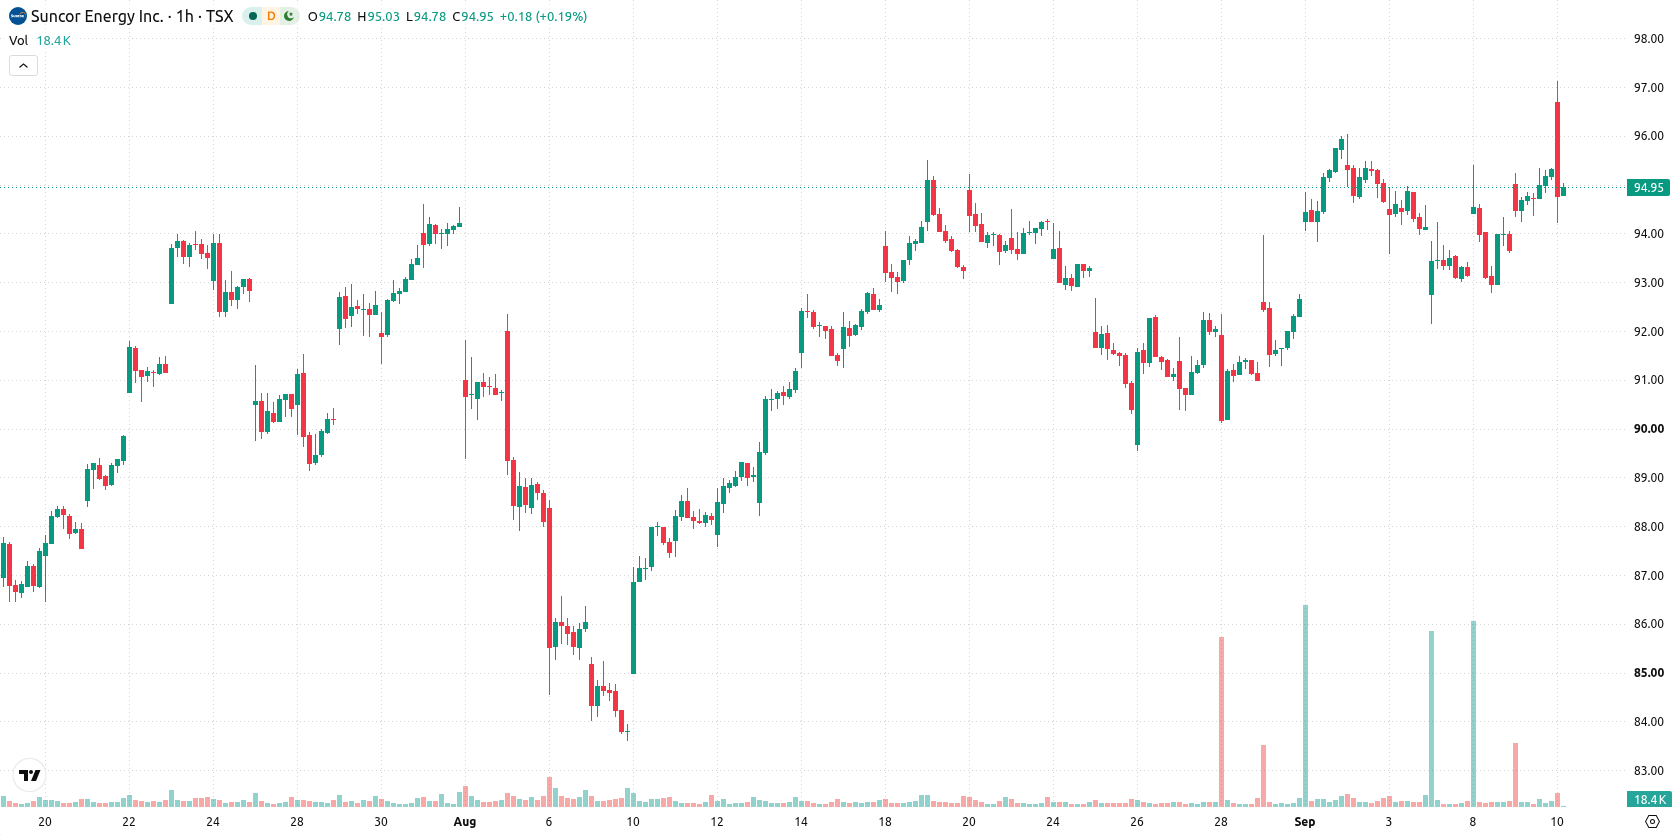
Suncor Energy (SU) stock is trading at C$95.04 after a modest decline on the day. The price remains positioned above its key moving averages, indicating ongoing strength relative to recent trends.
 97.35
99.76
Highlights
- Shares of Suncor Energy are in a bullish trend, trading above all key moving averages on the hourly chart.
- Most momentum indicators show firm buy signals but several are overbought, indicating a potentially extended short-term move.
- Suncor Energy stock is expected to consolidate between C$93.63 and C$96.45, with a very high probability of an upside move and strong intraday buyer support.
Technical support persists as oscillators flag overbought conditions
On the hourly chart, SU has traded above the MA-20, MA-50, and stands well clear of its MA-200, confirming robust support across all examined moving averages. The Ichimoku Kijun line is situated at C$93.78, functioning as a nearby support level. Among oscillators, MACD and Awesome Oscillator both generate buy signals, while ADX is neutral, and Bull/Bear Power points to buyers maintaining an advantage intraday. RSI remains in buy territory, yet both Stochastic RSI and CCI are overbought, indicating the current advance may be overstretched in the short term and a pullback could occur. Despite a gap lower at the open and an intraday movement towards the session low, the majority of technical signals continue to favor buying momentum.
Range-bound outlook persists as upside breakout risk rises
Over the coming sessions, SU is expected to consolidate within a trading band of C$93.63 to C$96.45, in line with the asset’s moderate volatility conditions. The baseline scenario anticipates continued range-bound action within this corridor. A decisive break above C$96.45 would indicate renewed bullish momentum and open the way for higher price targets, while a drop below C$93.63 support could lead to further retracement. The probability of an upside breakout remains very high compared to the relatively low risk of a meaningful decline.
Earlier, analysts noted that Suncor Energy stock was in a consolidation phase with mixed short-term technical signals. With the current analysis highlighting growing buy momentum but also overbought conditions, investors should monitor for a potential breakout or signs of a short-term pullback as price approaches the upper end of the trading range.









-
 Afghanistan
-
 Albania
-
 Algeria
-
 Angola
-
 Argentina
-
 Armenia
-
 Australia
-
 Austria
-
 Azerbaijan
-
 Bahamas
-
 Bahrain
-
 Bangladesh
-
 Belarus
-
 Belgium
-
 Bolivia
-
 Botswana
-
 Brazil
-
 Brunei
-
 Bulgaria
-
 Cambodia
-
 Cameroon
-
 Canada
-
 Chile
-
 China
-
 Colombia
-
 Congo
-
 Costa Rica
-
 Cote d'Ivoire
-
 Croatia
-
 Cuba
-
 Cyprus
-
 Czechia
-
 DR Congo
-
 Denmark
-
 Dominican Republic
-
 Ecuador
-
 Egypt
-
 El Salvador
-
 Estonia
-
 Eswatini
-
 Ethiopia
-
 Finland
-
 France
-
 Georgia
-
 Germany
-
 Ghana
-
 Greece
-
 Haiti
-
 Hong Kong
-
 Hungary
-
 India
-
 Indonesia
-
 Iran, Islamic republic
-
 Iraq
-
 Ireland
-
 Israel
-
 Italy
-
 Jamaica
-
 Japan
-
 Jordan
-
 Kazakhstan
-
 Kenya
-
 Korea
-
 Kuwait
-
 Kyrgyzstan
-
 Laos
-
 Latvia
-
 Lebanon
-
 Lesotho
-
 Libya
-
 Lithuania
-
 Luxembourg
-
 Madagascar
-
 Malaysia
-
 Malta
-
 Mauritius
-
 Mexico
-
 Moldova
-
 Mongolia
-
 Montenegro
-
 Morocco
-
 Mozambique
-
 Myanmar
-
 Namibia
-
 Nepal
-
 Netherlands
-
 New Zealand
-
 Nigeria
-
 North Macedonia
-
 Norway
-
 Oman
-
 Pakistan
-
 Palestine
-
 Panama
-
 Papua New Guinea
-
 Paraguay
-
 Peru
-
 Philippines
-
 Poland
-
 Portugal
-
 Puerto Rico
-
 Qatar
-
 Reunion
-
 Romania
-
 Rwanda
-
 Saudi Arabia
-
 Serbia
-
 Singapore
-
 Slovakia
-
 Slovenia
-
 Somalia
-
 South Africa
-
 Spain
-
 Sri Lanka
-
 Sweden
-
 Switzerland
-
 Syria
-
 Taiwan
-
 Tajikistan
-
 Tanzania
-
 Thailand
-
 Trinidad and Tobago
-
 Tunisia
-
 Turkey
-
 UAE
-
 Uganda
-
 Ukraine
-
 United Kingdom
-
United States
-
 Uruguay
-
 Uzbekistan
-
 Venezuela
-
 Vietnam
-
 Yemen
-
 Zambia
-
 Zimbabwe
- Forex
- Crypto












