


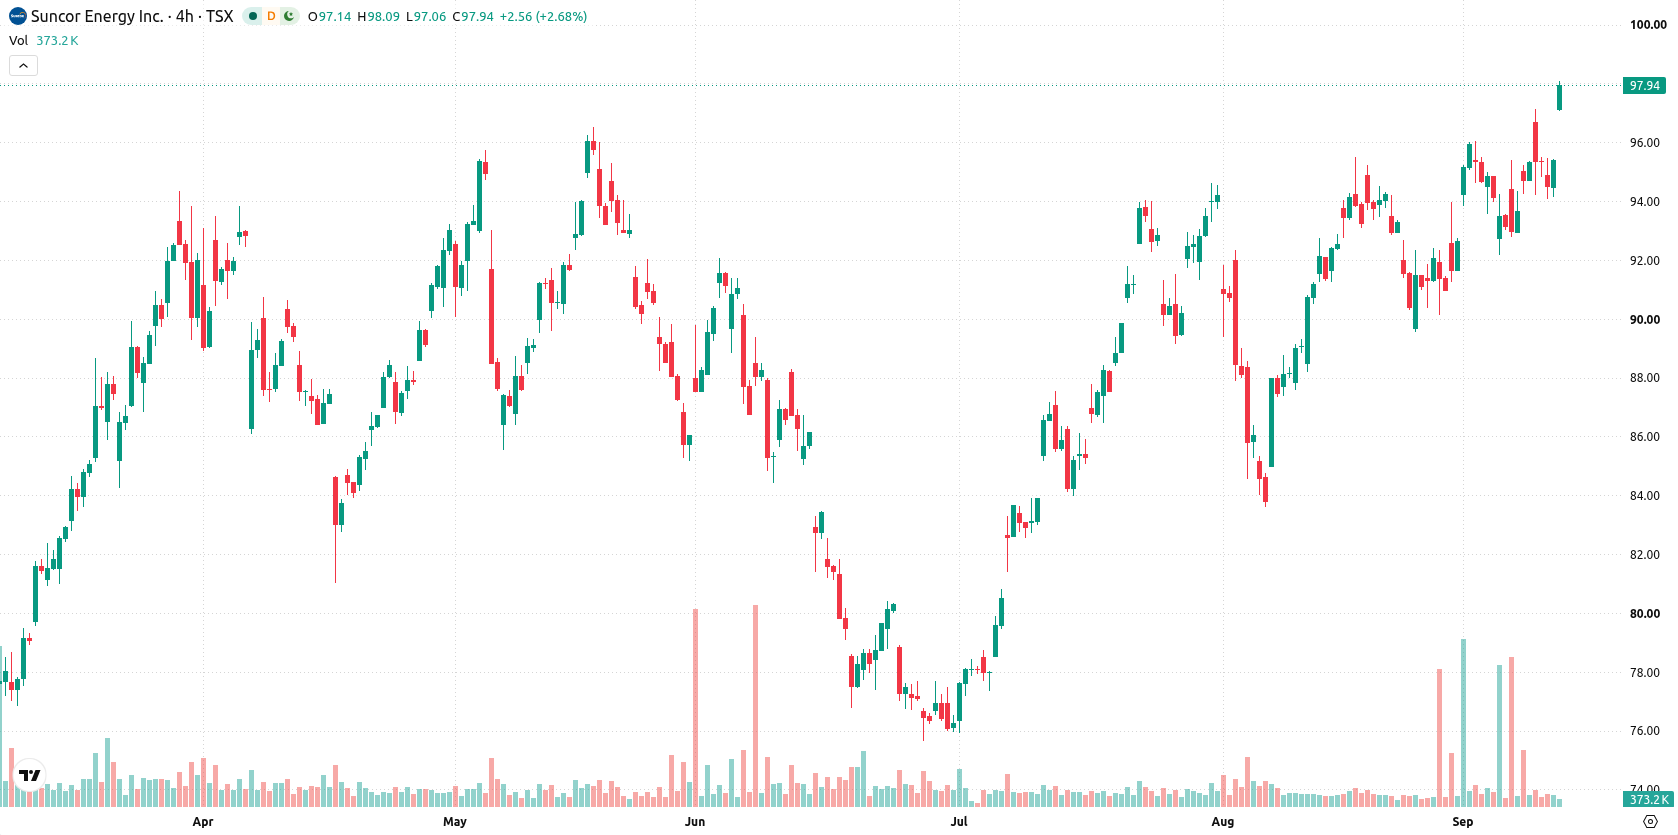
Suncor Energy Inc. (SU) advanced 2.93% as sustained bullish momentum and strong buying pressure on technical signals propelled the stock higher in the absence of a clear news catalyst. The move is reinforced by prices holding well above all major moving averages, confirming trend strength across all timeframes.
 97.35
99.76
Highlights
- Shares of Suncor Energy remain above key moving averages, confirming bullish momentum across all timeframes.
- Momentum indicators generate buy signals as the stock gains 2.93% to C$98.15 with strong short-term buying pressure.
- A breakout above C$100.16 would target new highs, while support sits at C$96.14 with high probability of sideways or upward trading.
Momentum signals diverge as price extends beyond moving averages
Suncor Energy is trading firmly above its 20-day, 50-day, and 200-day moving averages at C$93.38, C$89.68, and C$80.99, reflecting bullish momentum over short, medium, and long horizons. The near-term resistance is at C$100.16, with key support at C$96.81, and the 50-day average tracking securely above the 200-day affirms a strong uptrend. Momentum indicators are mostly positive: MACD and CCI register buy signals, RSI is close to the overbought level at 59.75, and short-term Bull/Bear Power is positive at 1.57. However, the ADX and Stochastic RSI both indicate a neutral trend strength, suggesting divergence among oscillators. Intraday, the stock experienced a strong rally and held close to session highs, with volatility marked at 1.45%.
Earlier, analysts noted that Suncor Energy’s technical outlook was mixed, with signals of consolidation and heightened volatility amid diverging momentum indicators. The latest price action, with solid advances above key moving averages and firm near-term support, presents a reaffirmed bullish setup in the short term, making the C$100.16 resistance a critical level to monitor for potential breakout opportunities.








-
 Afghanistan
-
 Albania
-
 Algeria
-
 Angola
-
 Argentina
-
 Armenia
-
 Australia
-
 Austria
-
 Azerbaijan
-
 Bahamas
-
 Bahrain
-
 Bangladesh
-
 Belarus
-
 Belgium
-
 Bolivia
-
 Botswana
-
 Brazil
-
 Brunei
-
 Bulgaria
-
 Cambodia
-
 Cameroon
-
 Canada
-
 Chile
-
 China
-
 Colombia
-
 Congo
-
 Costa Rica
-
 Cote d'Ivoire
-
 Croatia
-
 Cuba
-
 Cyprus
-
 Czechia
-
 DR Congo
-
 Denmark
-
 Dominican Republic
-
 Ecuador
-
 Egypt
-
 El Salvador
-
 Estonia
-
 Eswatini
-
 Ethiopia
-
 Finland
-
 France
-
 Georgia
-
 Germany
-
 Ghana
-
 Greece
-
 Haiti
-
 Hong Kong
-
 Hungary
-
 India
-
 Indonesia
-
 Iran, Islamic republic
-
 Iraq
-
 Ireland
-
 Israel
-
 Italy
-
 Jamaica
-
 Japan
-
 Jordan
-
 Kazakhstan
-
 Kenya
-
 Korea
-
 Kuwait
-
 Kyrgyzstan
-
 Laos
-
 Latvia
-
 Lebanon
-
 Lesotho
-
 Libya
-
 Lithuania
-
 Luxembourg
-
 Madagascar
-
 Malaysia
-
 Malta
-
 Mauritius
-
 Mexico
-
 Moldova
-
 Mongolia
-
 Montenegro
-
 Morocco
-
 Mozambique
-
 Myanmar
-
 Namibia
-
 Nepal
-
 Netherlands
-
 New Zealand
-
 Nigeria
-
 North Macedonia
-
 Norway
-
 Oman
-
 Pakistan
-
 Palestine
-
 Panama
-
 Papua New Guinea
-
 Paraguay
-
 Peru
-
 Philippines
-
 Poland
-
 Portugal
-
 Puerto Rico
-
 Qatar
-
 Reunion
-
 Romania
-
 Rwanda
-
 Saudi Arabia
-
 Serbia
-
 Singapore
-
 Slovakia
-
 Slovenia
-
 Somalia
-
 South Africa
-
 Spain
-
 Sri Lanka
-
 Sweden
-
 Switzerland
-
 Syria
-
 Taiwan
-
 Tajikistan
-
 Tanzania
-
 Thailand
-
 Trinidad and Tobago
-
 Tunisia
-
 Turkey
-
 UAE
-
 Uganda
-
 Ukraine
-
 United Kingdom
-
United States
-
 Uruguay
-
 Uzbekistan
-
 Venezuela
-
 Vietnam
-
 Yemen
-
 Zambia
-
 Zimbabwe
- Forex
- Crypto












