

IBM climbs nearly 3% after elevated volatility and bullish signals keep buyers in control

International Business Machines Corporation (IBM) advanced 2.66% as strong intraday momentum and sustained buying pressure drove the stock higher. The move is supported by IBM trading above its 20-day and 50-day moving averages, even as the longer-term bearish trend remains in place.
 259.59
Highlights
- IBM stock trades above its 20-day and 50-day moving averages but remains below the 200-day, indicating a short- and medium-term bullish trend within a longer-term bearish structure.
- Mixed momentum signals show buyers dominating and multiple oscillators in overbought territory, suggesting further gains may meet resistance.
- For the coming five trading days, IBM stock is projected to trade between $243.26 and $256.12 with a 58% probability of an upward move.
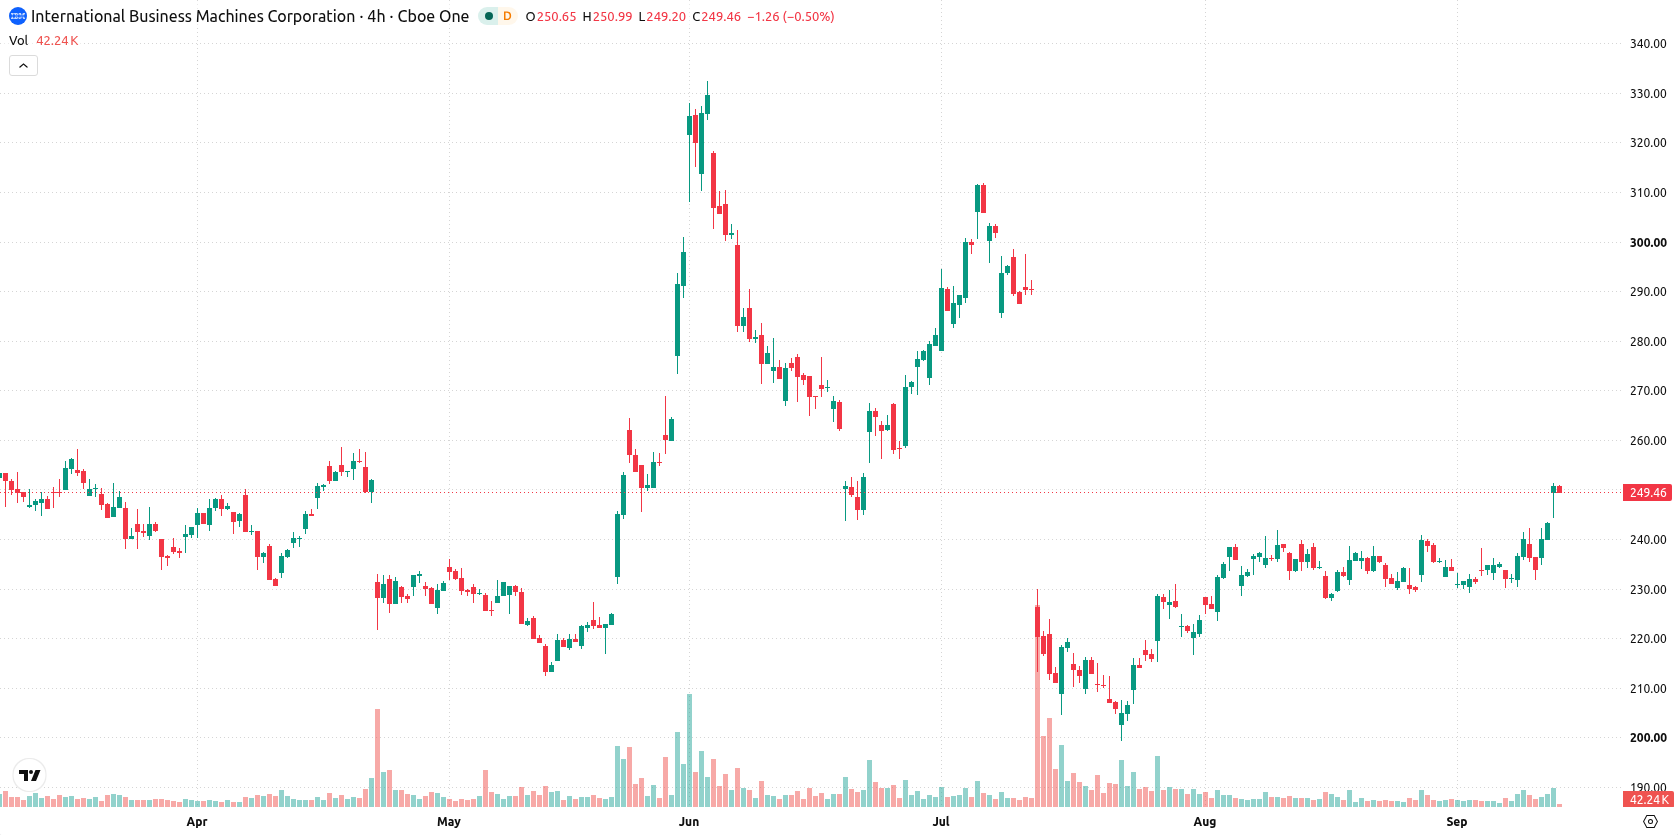
Bullish bias prevails as price momentum clashes with mixed signals
IBM is currently trading above its 20-day and 50-day moving averages at $234.38 and $237.99, though it remains below the 200-day average at $261.24. This setup highlights ongoing bullish momentum in the short and medium term, but with a longer-term bearish undertone. Key levels include immediate resistance at $251.3 and support at $244.26, as well as the Ichimoku Kijun line near $235.52, which acts as a distant support, confirming the prevailing upward trend. On the indicators front, the MACD and ADX point to neutral momentum. The RSI signals a "Buy" at 56.83, but the Stochastic RSI and CCI both show overbought conditions. Bull/Bear Power readings are strongly overbought, with buyers currently dominating. The Awesome Oscillator is neutral and does not confirm the prevailing trend. Volatility is elevated at 2.88%, with the price moving near intraday highs after opening with an upside gap.
Earlier, analysts noted that IBM was maintaining notable relative strength and exhibiting bullish technical momentum within the broader technology sector. The current analysis builds on this outlook, as ongoing short- and medium-term bullish momentum keeps upward breakout potential on the table, with $251.3 remaining the key resistance level to monitor in the days ahead.










-
 Afghanistan
-
 Albania
-
 Algeria
-
 Angola
-
 Argentina
-
 Armenia
-
 Australia
-
 Austria
-
 Azerbaijan
-
 Bahamas
-
 Bahrain
-
 Bangladesh
-
 Belarus
-
 Belgium
-
 Bolivia
-
 Botswana
-
 Brazil
-
 Brunei
-
 Bulgaria
-
 Cambodia
-
 Cameroon
-
 Canada
-
 Chile
-
 China
-
 Colombia
-
 Congo
-
 Costa Rica
-
 Cote d'Ivoire
-
 Croatia
-
 Cuba
-
 Cyprus
-
 Czechia
-
 DR Congo
-
 Denmark
-
 Dominican Republic
-
 Ecuador
-
 Egypt
-
 El Salvador
-
 Estonia
-
 Eswatini
-
 Ethiopia
-
 Finland
-
 France
-
 Georgia
-
 Germany
-
 Ghana
-
 Greece
-
 Haiti
-
 Hong Kong
-
 Hungary
-
 India
-
 Indonesia
-
 Iran, Islamic republic
-
 Iraq
-
 Ireland
-
 Israel
-
 Italy
-
 Jamaica
-
 Japan
-
 Jordan
-
 Kazakhstan
-
 Kenya
-
 Korea
-
 Kuwait
-
 Kyrgyzstan
-
 Laos
-
 Latvia
-
 Lebanon
-
 Lesotho
-
 Libya
-
 Lithuania
-
 Luxembourg
-
 Madagascar
-
 Malaysia
-
 Malta
-
 Mauritius
-
 Mexico
-
 Moldova
-
 Mongolia
-
 Montenegro
-
 Morocco
-
 Mozambique
-
 Myanmar
-
 Namibia
-
 Nepal
-
 Netherlands
-
 New Zealand
-
 Nigeria
-
 North Macedonia
-
 Norway
-
 Oman
-
 Pakistan
-
 Palestine
-
 Panama
-
 Papua New Guinea
-
 Paraguay
-
 Peru
-
 Philippines
-
 Poland
-
 Portugal
-
 Puerto Rico
-
 Qatar
-
 Reunion
-
 Romania
-
 Rwanda
-
 Saudi Arabia
-
 Serbia
-
 Singapore
-
 Slovakia
-
 Slovenia
-
 Somalia
-
 South Africa
-
 Spain
-
 Sri Lanka
-
 Sweden
-
 Switzerland
-
 Syria
-
 Taiwan
-
 Tajikistan
-
 Tanzania
-
 Thailand
-
 Trinidad and Tobago
-
 Tunisia
-
 Turkey
-
 UAE
-
 Uganda
-
 Ukraine
-
 United Kingdom
-
United States
-
 Uruguay
-
 Uzbekistan
-
 Venezuela
-
 Vietnam
-
 Yemen
-
 Zambia
-
 Zimbabwe
- Forex
- Crypto












