


Credo Technology Group Holding Ltd (CRDO) fell 5.87% on strong renewed selling pressure, as negative momentum and deeply oversold readings weighed heavily. The decline looks limited for now, with the stock having already broken below its key moving averages and testing immediate support.
 195.50
224.25
195.50
224.25
Highlights
- Credo Technology stock closed at $152.88, trading below key moving averages and indicating sustained downside momentum.
- Technical indicators show oversold conditions with sellers dominating, as the stock dropped 5.87% with a downside gap today.
- Traders should watch the $154 resistance and $149.42 support, with the expected 5-day range at $136.99 to $161.94 and a 70% probability of further declines.
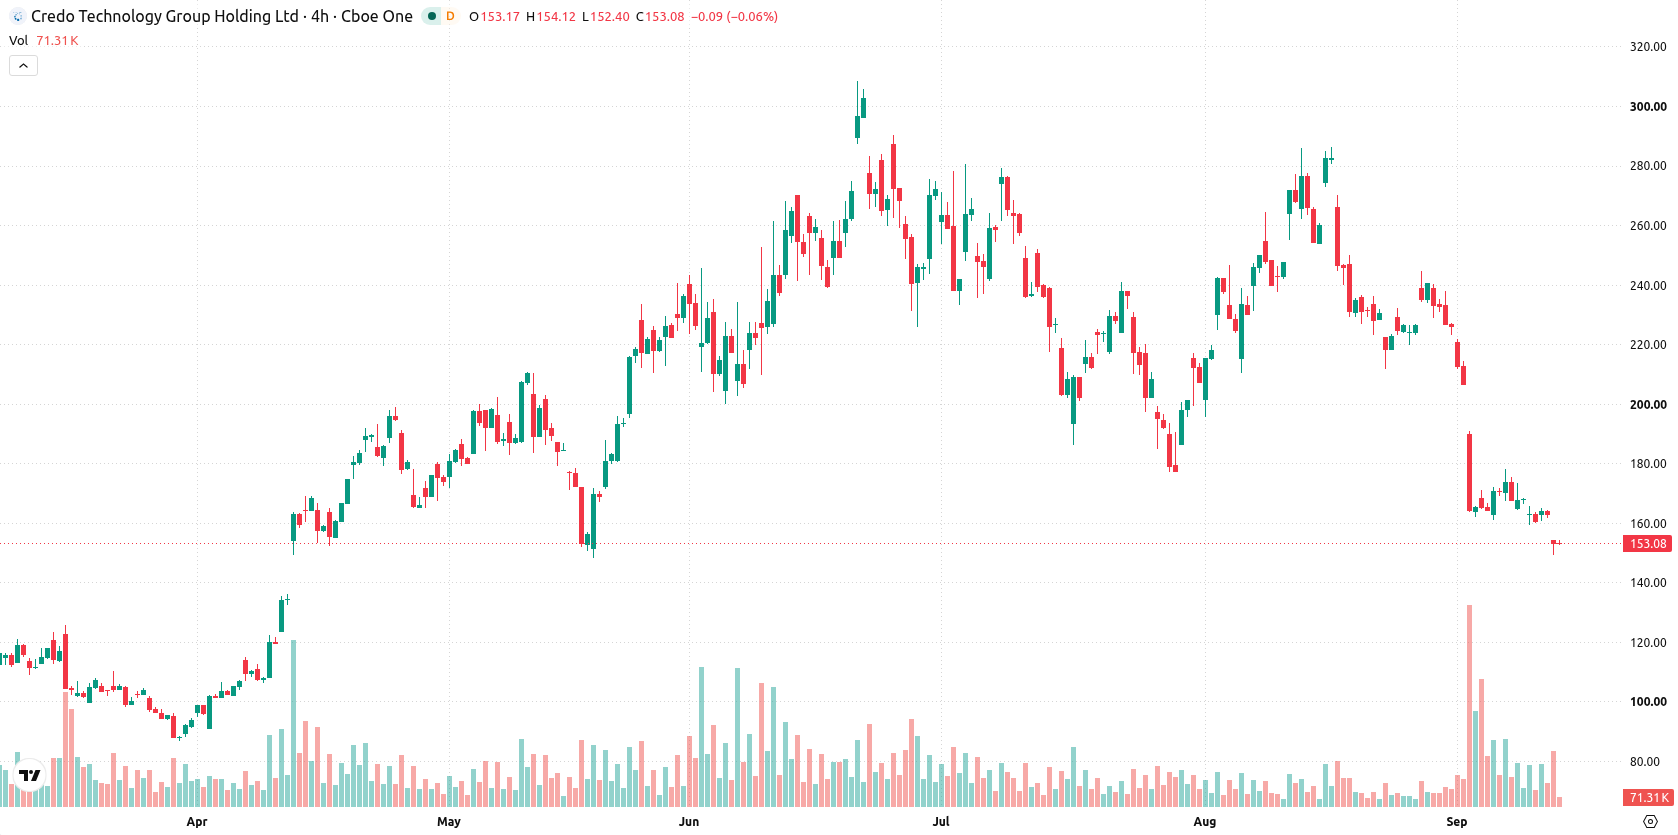
Technical breakdown persists as oversold momentum signals dominate
Credo Technology is trading at $152.88, below its 20-day ($211.19), 50-day ($223.06), and 200-day ($175.89) moving averages, reflecting persistent short- and medium-term pressure and a break of longer-term support. The nearest resistance is the near-term ceiling at $154, with immediate support at the near-term floor of $149.42. Momentum readings are negative as the MACD signals sell and the ADX reads neutral, indicating a lack of clear trend strength. The RSI at 33.16, Stochastic RSI at 7.63, CCI at -104.48, and BBP at -22.43 all flag oversold conditions, showing that sellers dominate intraday momentum. The stock fell $9.53 or 5.87% today after a downside gap of about $9.16 (5.64%) and currently sits near the high of its intraday range, with intraday volatility at 3.07%. This session points to continued pressure after the open, with oversold signals indicating the decline may be stretched in the very short term.
Earlier, analysts noted that Credo Technology's technical outlook was under pressure, with persistent selling challenging its long-term support. The latest move below its 200-day moving average and the emergence of deeply oversold conditions now highlight the $149.42 near-term floor as the decisive level to watch for continued downside risk or potential stabilization.










-
 Afghanistan
-
 Albania
-
 Algeria
-
 Angola
-
 Argentina
-
 Armenia
-
 Australia
-
 Austria
-
 Azerbaijan
-
 Bahamas
-
 Bahrain
-
 Bangladesh
-
 Belarus
-
 Belgium
-
 Bolivia
-
 Botswana
-
 Brazil
-
 Brunei
-
 Bulgaria
-
 Cambodia
-
 Cameroon
-
 Canada
-
 Chile
Chile
-
 China
China
-
 Colombia
-
 Congo
Congo
-
 Costa Rica
-
 Cote d'Ivoire
-
 Croatia
-
 Cuba
Cuba
-
 Cyprus
-
 Czechia
-
 DR Congo
-
 Denmark
-
 Dominican Republic
-
 Ecuador
-
 Egypt
Egypt
-
 El Salvador
-
 Estonia
-
 Eswatini
-
 Ethiopia
-
 Finland
-
 France
-
 Georgia
-
 Germany
-
 Ghana
Ghana
-
 Greece
-
 Haiti
Haiti
-
 Hong Kong
-
 Hungary
-
 India
India
-
 Indonesia
-
 Iran, Islamic republic
-
 Iraq
Iraq
-
 Ireland
-
 Israel
-
 Italy
Italy
-
 Jamaica
-
 Japan
Japan
-
 Jordan
-
 Kazakhstan
-
 Kenya
Kenya
-
 Korea
Korea
-
 Kuwait
-
 Kyrgyzstan
-
 Laos
Laos
-
 Latvia
-
 Lebanon
-
 Lesotho
-
 Libya
Libya
-
 Lithuania
-
 Luxembourg
-
 Madagascar
-
 Malaysia
-
 Malta
Malta
-
 Mauritius
-
 Mexico
-
 Moldova
-
 Mongolia
-
 Montenegro
-
 Morocco
-
 Mozambique
-
 Myanmar
-
 Namibia
-
 Nepal
Nepal
-
 Netherlands
-
 New Zealand
-
 Nigeria
-
 North Macedonia
-
 Norway
-
 Oman
Oman
-
 Pakistan
-
 Palestine
-
 Panama
-
 Papua New Guinea
-
 Paraguay
-
 Peru
Peru
-
 Philippines
-
 Poland
-
 Portugal
-
 Puerto Rico
-
 Qatar
Qatar
-
 Reunion
-
 Romania
-
 Rwanda
-
 Saudi Arabia
-
 Serbia
-
 Singapore
-
 Slovakia
-
 Slovenia
-
 Somalia
-
 South Africa
-
 Spain
Spain
-
 Sri Lanka
-
 Sweden
-
 Switzerland
-
 Syria
Syria
-
 Taiwan
-
 Tajikistan
-
 Tanzania
-
 Thailand
-
 Trinidad and Tobago
-
 Tunisia
-
 Turkey
-
 UAE
UAE
-
 Uganda
-
 Ukraine
-
 United Kingdom
-
United States
-
 Uruguay
-
 Uzbekistan
-
 Venezuela
-
 Vietnam
-
 Yemen
Yemen
-
 Zambia
-
 Zimbabwe
- Forex
- Crypto












