

IBM shares face limited trend direction as indicators register overbought: weekly analysis

Shares of International Business Machines Corporation (IBM) are trading near $249 after gaining just over 2% for the week, as buyers pushed prices higher but the rally now shows signs of exhaustion. The chart reflects sharply stretched momentum alongside overbought signals, putting the focus on whether IBM can consolidate or will face pressure near resistance in the sessions ahead.
 259.34
Highlights
- Shares of IBM ended the week at $248.73, gaining $5.52 or 2.13% and finishing at the top of their recent range.
- The stock remains above its 20-day and 50-day moving averages but trades below the 200-day, indicating a weak long-term trend.
- Technicals are stretched with multiple overbought signals, and IBM is expected to consolidate between $239.45 and $258 over the next five days.
Dividend scrutiny shapes sentiment as earnings and valuation drive focus
IBM released its second quarter earnings last week, giving investors fresh insight into its financial performance, as reported by StockStory.org. Dividend stability remained in focus, highlighted by MaxDividends.com, which included IBM in a feature on Dividend Aristocrats and raised questions about its valuation. These developments shape sentiment for the week ahead against a backdrop of stable, yet scrutinized, dividend payments.
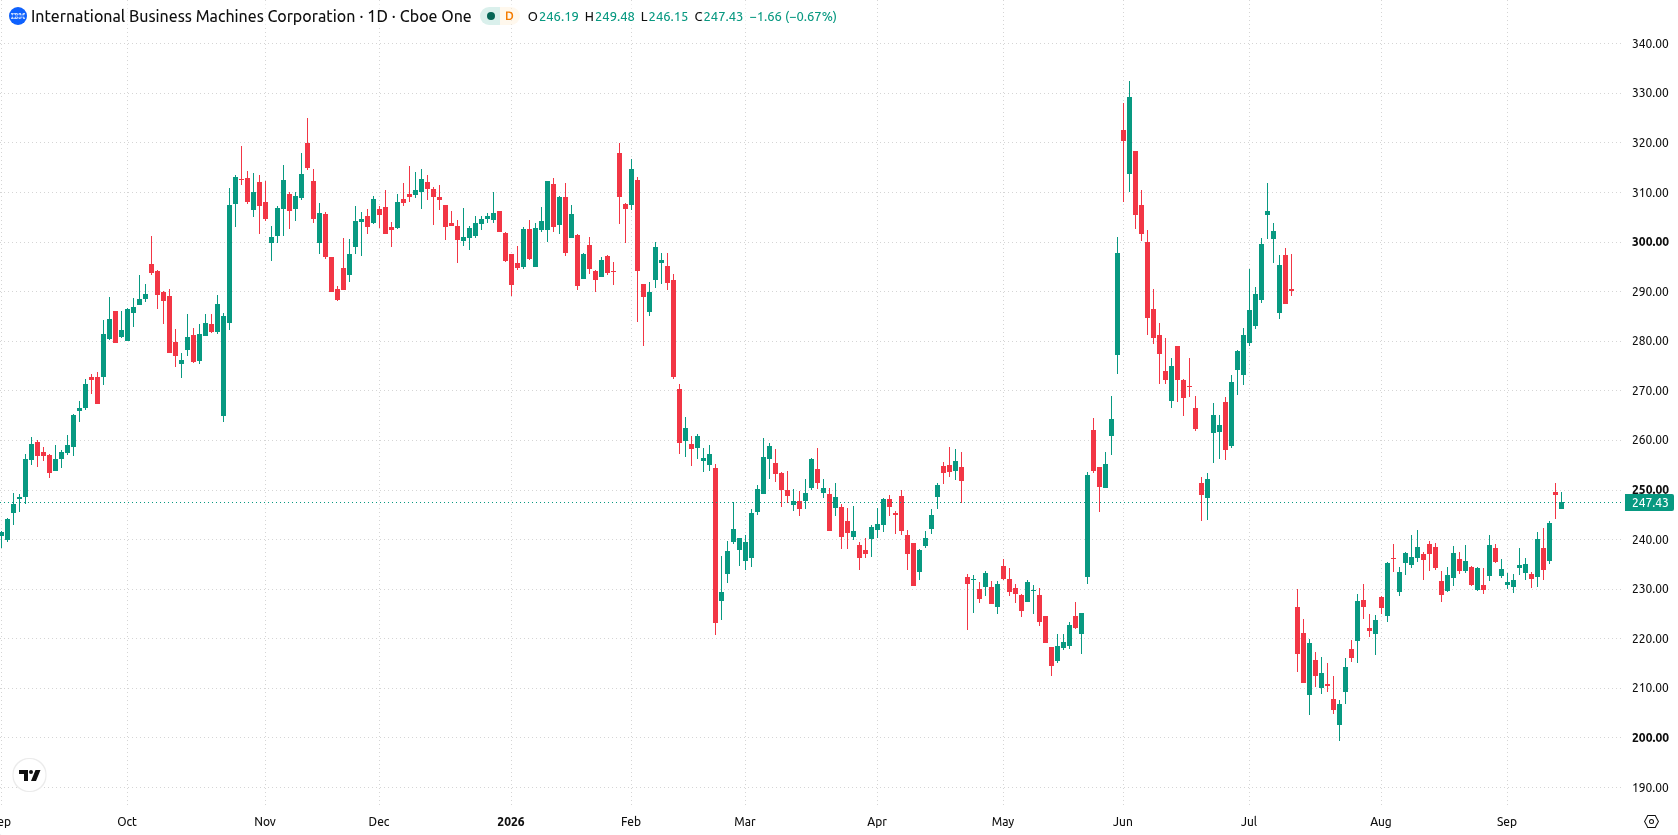
Bullish momentum stretches as overbought indicators signal potential consolidation
On the daily chart, the stock shows a sharp move higher without a sustained trend, propelled by a surge in short-term momentum as seen in the CCI reading of 315.38, placing it firmly in the overbought zone. RSI is approaching overbought while Bull/Bear Power also registers as overbought, reinforcing the signal that bullish momentum may be stretched. The key support is at $239.39 (Ichimoku Kijun), with resistance at $251.37, as volatility over the past week reached 9%. This combination suggests consolidation near resistance, with limited immediate trend direction.
Breakout risk rises as the stock approaches resistance in the week ahead
Over the next five trading days, the stock is expected to fluctuate between $239.45 and $258, with a 68% probability of an increase and 32% chance of a decrease. The base case scenario sees IBM holding within this range, likely consolidating near resistance at $251.37. A decisive break above $251.37 would open the door for renewed upward momentum toward the top end of the expected range. Conversely, a drop below support at $239.39 would shift sentiment bearish, exposing the lower boundary for further declines.
Earlier, analysts noted that IBM was demonstrating ongoing bullish momentum, with buyers dominating trading and short- to medium-term trends remaining positive despite longer-term uncertainties. The latest technical setup—marked by stretched overbought readings and pronounced volatility—adds caution to this outlook, with traders now advised to monitor the potential for consolidation or a breakout as the stock approaches resistance at $251.37.










-
 Afghanistan
-
 Albania
-
 Algeria
-
 Angola
-
 Argentina
-
 Armenia
-
 Australia
-
 Austria
-
 Azerbaijan
-
 Bahamas
-
 Bahrain
-
 Bangladesh
-
 Belarus
-
 Belgium
-
 Bolivia
-
 Botswana
-
 Brazil
-
 Brunei
-
 Bulgaria
-
 Cambodia
-
 Cameroon
-
 Canada
-
 Chile
-
 China
-
 Colombia
-
 Congo
-
 Costa Rica
-
 Cote d'Ivoire
-
 Croatia
-
 Cuba
-
 Cyprus
-
 Czechia
-
 DR Congo
-
 Denmark
-
 Dominican Republic
-
 Ecuador
-
 Egypt
-
 El Salvador
-
 Estonia
-
 Eswatini
-
 Ethiopia
-
 Finland
-
 France
-
 Georgia
-
 Germany
-
 Ghana
-
 Greece
-
 Haiti
-
 Hong Kong
-
 Hungary
-
 India
-
 Indonesia
-
 Iran, Islamic republic
-
 Iraq
-
 Ireland
-
 Israel
-
 Italy
-
 Jamaica
-
 Japan
-
 Jordan
-
 Kazakhstan
-
 Kenya
-
 Korea
-
 Kuwait
-
 Kyrgyzstan
-
 Laos
-
 Latvia
-
 Lebanon
-
 Lesotho
-
 Libya
-
 Lithuania
-
 Luxembourg
-
 Madagascar
-
 Malaysia
-
 Malta
-
 Mauritius
-
 Mexico
-
 Moldova
-
 Mongolia
-
 Montenegro
-
 Morocco
-
 Mozambique
-
 Myanmar
-
 Namibia
-
 Nepal
-
 Netherlands
-
 New Zealand
-
 Nigeria
-
 North Macedonia
-
 Norway
-
 Oman
-
 Pakistan
-
 Palestine
-
 Panama
-
 Papua New Guinea
-
 Paraguay
-
 Peru
-
 Philippines
-
 Poland
-
 Portugal
-
 Puerto Rico
-
 Qatar
-
 Reunion
-
 Romania
-
 Rwanda
-
 Saudi Arabia
-
 Serbia
-
 Singapore
-
 Slovakia
-
 Slovenia
-
 Somalia
-
 South Africa
-
 Spain
-
 Sri Lanka
-
 Sweden
-
 Switzerland
-
 Syria
-
 Taiwan
-
 Tajikistan
-
 Tanzania
-
 Thailand
-
 Trinidad and Tobago
-
 Tunisia
-
 Turkey
-
 UAE
-
 Uganda
-
 Ukraine
-
 United Kingdom
-
United States
-
 Uruguay
-
 Uzbekistan
-
 Venezuela
-
 Vietnam
-
 Yemen
-
 Zambia
-
 Zimbabwe
- Forex
- Crypto












