

Barrick Gold stock tests the 200-day moving average: Technical outlook

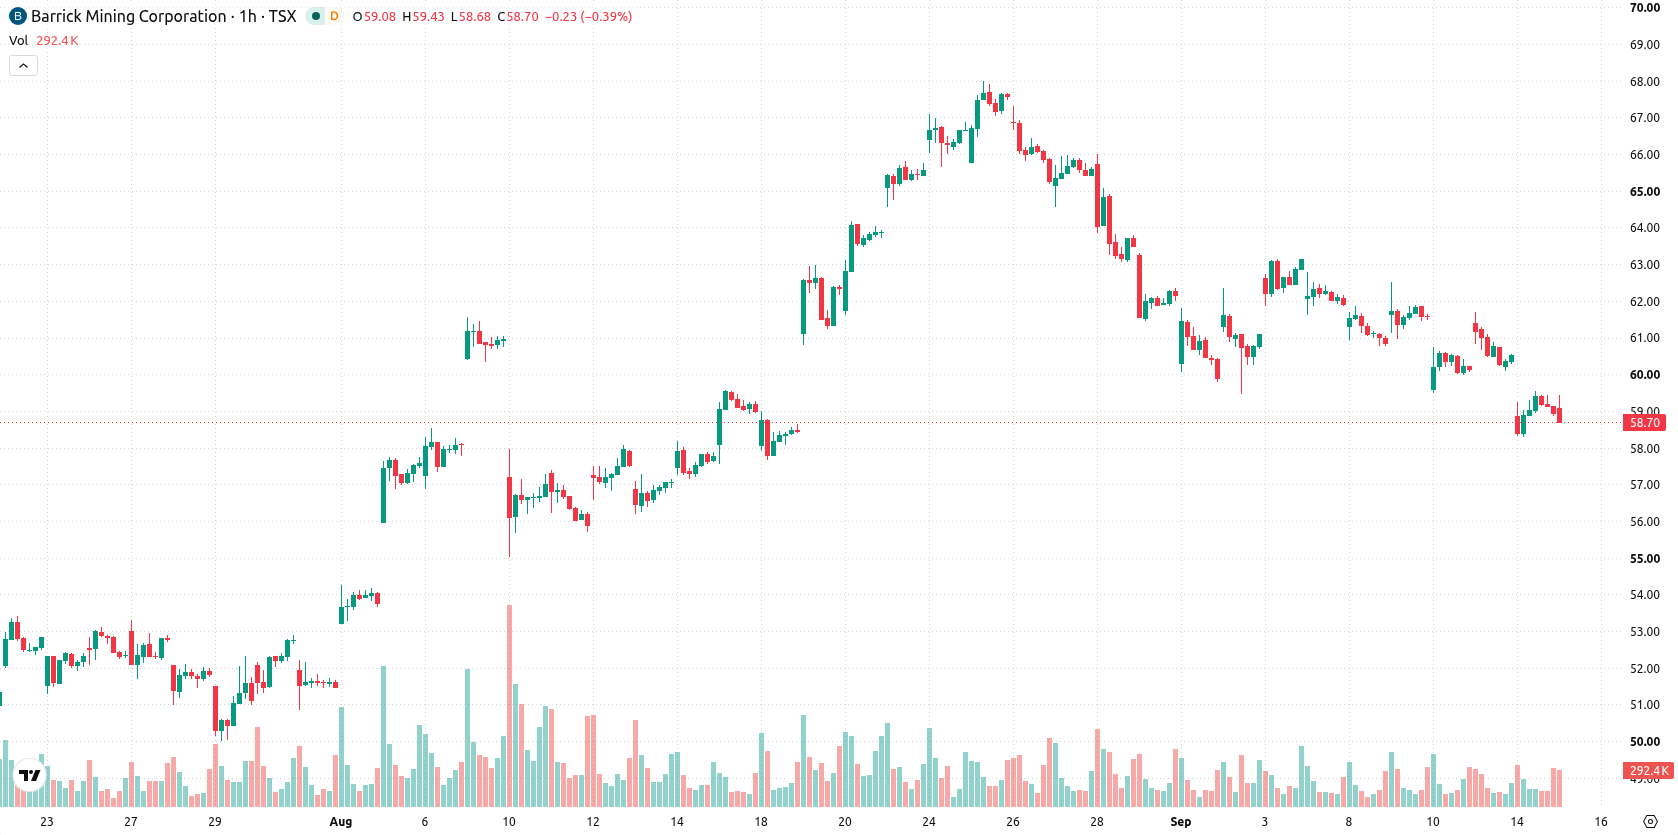
Barrick Gold (ABX) stock is trading at C$58.81 after a modest decline in the latest session. The price remains below its key moving averages, indicating ongoing pressure from sellers.
 53.05
55.57
Highlights
- Shares of ABX trade below key moving averages with persistent selling pressure dominating across all observed timeframes.
- Bearish momentum is confirmed by MACD and ADX, with mixed signals from oscillators but overall seller dominance.
- Expected price range for ABX stock over the next 2 to 3 days is C$56.98 to C$60.64, with further downside more likely than recovery.
Bearish momentum prevails amid mixed oscillator signals
ABX is trading below the MA-20 at C$59.92 and MA-50 at C$61.05 on the hourly chart, with the current price also underneath the long-term MA-200 at C$59.15. The Ichimoku Kijun at C$60.09 provides immediate resistance. Momentum indicators reflect continued selling: both MACD and ADX signal bearish strength. RSI registers 39.84 and CCI also points to sell, while Stochastic RSI gives a buy signal, introducing a measure of divergence, and Bull/Bear Power supports seller dominance. The Awesome Oscillator remains neutral, offering little directional guidance as intraday volatility contracts. This blend of indicator signals suggests that while sellers are in control, short-term oscillators indicate developing oversold conditions, though not enough to shift the broader setup.
Downside risk elevated as resistance limits potential rebound
Over the next 2–3 trading days, ABX is expected to remain within the C$56.98 to C$60.64 volatility band relative to current levels. The probability of upward price action is considered very low, while the probability of a further decline is high, with immediate resistance at C$60.09. A sustained break above this resistance could open the door for upside momentum, while a move below C$56.98 would confirm further downside continuation in line with the prevailing trend.
Earlier, analysts noted that Barrick Gold faced continued downside pressure and rangebound trading amid mixed technical signals. The current analysis strengthens this cautious outlook, with the prevailing scenario favoring ongoing weakness and C$60.09 emerging as a critical resistance level to monitor for potential reversal.










-
 Afghanistan
-
 Albania
-
 Algeria
-
 Angola
-
 Argentina
-
 Armenia
-
 Australia
-
 Austria
-
 Azerbaijan
-
 Bahamas
-
 Bahrain
-
 Bangladesh
-
 Belarus
-
 Belgium
-
 Bolivia
-
 Botswana
-
 Brazil
-
 Brunei
-
 Bulgaria
-
 Cambodia
-
 Cameroon
-
 Canada
-
 Chile
-
 China
-
 Colombia
-
 Congo
-
 Costa Rica
-
 Cote d'Ivoire
-
 Croatia
-
 Cuba
-
 Cyprus
-
 Czechia
-
 DR Congo
-
 Denmark
-
 Dominican Republic
-
 Ecuador
-
 Egypt
-
 El Salvador
-
 Estonia
-
 Eswatini
-
 Ethiopia
-
 Finland
-
 France
-
 Georgia
-
 Germany
-
 Ghana
-
 Greece
-
 Haiti
-
 Hong Kong
-
 Hungary
-
 India
-
 Indonesia
-
 Iran, Islamic republic
-
 Iraq
-
 Ireland
-
 Israel
-
 Italy
-
 Jamaica
-
 Japan
-
 Jordan
-
 Kazakhstan
-
 Kenya
-
 Korea
-
 Kuwait
-
 Kyrgyzstan
-
 Laos
-
 Latvia
-
 Lebanon
-
 Lesotho
-
 Libya
-
 Lithuania
-
 Luxembourg
-
 Madagascar
-
 Malaysia
-
 Malta
-
 Mauritius
-
 Mexico
-
 Moldova
-
 Mongolia
-
 Montenegro
-
 Morocco
-
 Mozambique
-
 Myanmar
-
 Namibia
-
 Nepal
-
 Netherlands
-
 New Zealand
-
 Nigeria
-
 North Macedonia
-
 Norway
-
 Oman
-
 Pakistan
-
 Palestine
-
 Panama
-
 Papua New Guinea
-
 Paraguay
-
 Peru
-
 Philippines
-
 Poland
-
 Portugal
-
 Puerto Rico
-
 Qatar
-
 Reunion
-
 Romania
-
 Rwanda
-
 Saudi Arabia
-
 Serbia
-
 Singapore
-
 Slovakia
-
 Slovenia
-
 Somalia
-
 South Africa
-
 Spain
-
 Sri Lanka
-
 Sweden
-
 Switzerland
-
 Syria
-
 Taiwan
-
 Tajikistan
-
 Tanzania
-
 Thailand
-
 Trinidad and Tobago
-
 Tunisia
-
 Turkey
-
 UAE
-
 Uganda
-
 Ukraine
-
 United Kingdom
-
United States
-
 Uruguay
-
 Uzbekistan
-
 Venezuela
-
 Vietnam
-
 Yemen
-
 Zambia
-
 Zimbabwe
- Forex
- Crypto












