

eToro stock outlook: Seller pressure weighs after average invested amount per trade declines

eToro Group Ltd (ETOR) stock is trading at $28.95, declining 3.11% on the day and closing near the session's low. The current price is below its key moving averages, indicating persistent short-term and longer-term selling pressure.
 23.05
23.62
Highlights
- eToro Group Ltd. Assets under Administration reached $20.2 billion in August 2026, up 3% year-over-year with funded accounts rising 18% to 4.36 million.
- Total trades surged 31% to 51.7 million, but average invested amount per trade dropped 29% to $197, indicating potential pressure on transaction revenue.
- ETOR/USD trades below short-, medium-, and long-term moving averages with momentum indicators showing selling dominance; price is expected to range between $28.31 and $29.59 with further downside likely short term.
Platform asset growth and strong activity offset by lower trade size
eToro Group Ltd. reported Assets under Administration of $20.2 billion for August 2026, a 3% increase year-over-year, reflecting modest growth in overall platform assets, according to Investingnews. The number of funded accounts advanced 18% year-over-year to 4.36 million, and trading activity was robust, with a total of 51.7 million trades, up 31% year-over-year. However, the average invested amount per trade fell 29% to $197, which may weigh on transaction-related revenue streams and suggests a shift in client risk appetite, though price action has remained under broader selling pressure.
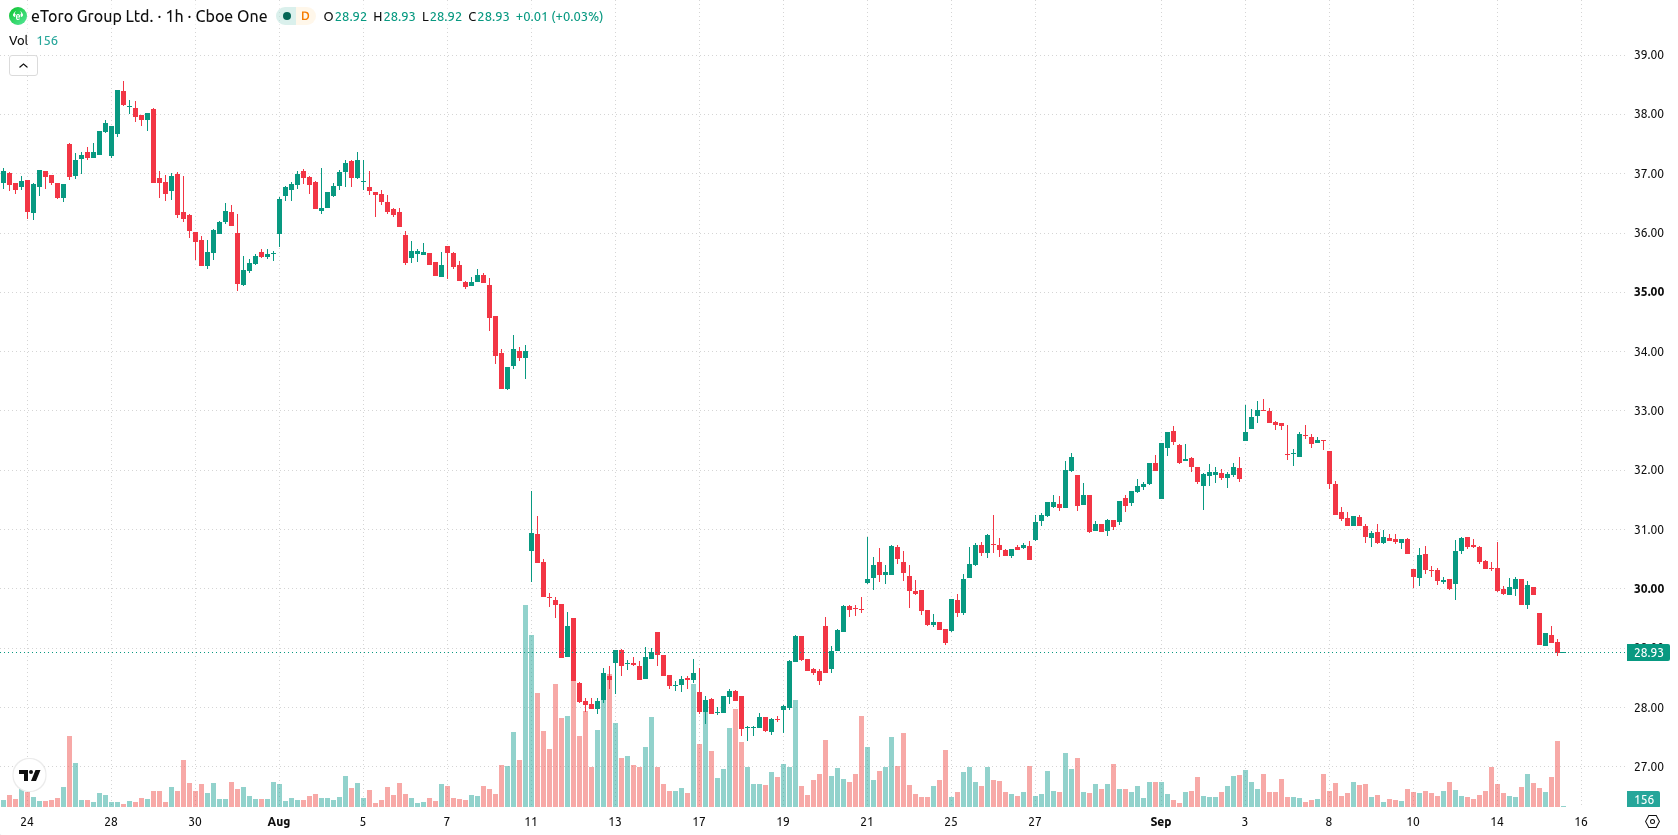
Bearish momentum affirmed as major support and resistance levels tested
On the technical front, ETOR is trading below the hourly SMA-20 at $30.27, the SMA-50 at $31.17, and remains well under the long-term SMA-200 at $34.74. Immediate resistance is marked by the Ichimoku Kijun level at $30.32, while support is identified at $28.31. Momentum indicators confirm weakness: MACD, ADX, RSI (at 39.16), Stochastic RSI, CCI, and Bull/Bear Power all give 'Sell' signals, while Awesome Oscillator is neutral. The consistent 'Sell' stance across these oscillators highlights a persistently bearish technical landscape.
Narrow trading expected as technical barriers constrain direction
In the coming days, the expected range for ETOR is between $28.31 and $29.59, reflecting muted volatility relative to recent declines. The base scenario anticipates continued consolidation within this corridor, while a bullish turnaround would require a clear move above the $30.32 resistance. In contrast, a sustained drop below the $28.31 support would likely trigger further downside momentum.
Earlier, analysts noted that eToro stock was experiencing persistent downside pressure and consolidating below major moving averages. The latest technical and fundamental updates reinforce this bearish outlook, with $28.31 serving as the critical support level to monitor for signs of further downside risk.











-
 Afghanistan
-
 Albania
-
 Algeria
-
 Angola
-
 Argentina
-
 Armenia
-
 Australia
-
 Austria
-
 Azerbaijan
-
 Bahamas
-
 Bahrain
-
 Bangladesh
-
 Belarus
-
 Belgium
-
 Bolivia
-
 Botswana
-
 Brazil
-
 Brunei
-
 Bulgaria
-
 Cambodia
-
 Cameroon
-
 Canada
-
 Chile
-
 China
-
 Colombia
-
 Congo
-
 Costa Rica
-
 Cote d'Ivoire
-
 Croatia
-
 Cuba
-
 Cyprus
-
 Czechia
-
 DR Congo
-
 Denmark
-
 Dominican Republic
-
 Ecuador
-
 Egypt
-
 El Salvador
-
 Estonia
-
 Eswatini
-
 Ethiopia
-
 Finland
-
 France
-
 Georgia
-
 Germany
-
 Ghana
-
 Greece
-
 Haiti
-
 Hong Kong
-
 Hungary
-
 India
-
 Indonesia
-
 Iran, Islamic republic
-
 Iraq
-
 Ireland
-
 Israel
-
 Italy
-
 Jamaica
-
 Japan
-
 Jordan
-
 Kazakhstan
-
 Kenya
-
 Korea
-
 Kuwait
-
 Kyrgyzstan
-
 Laos
-
 Latvia
-
 Lebanon
-
 Lesotho
-
 Libya
-
 Lithuania
-
 Luxembourg
-
 Madagascar
-
 Malaysia
-
 Malta
-
 Mauritius
-
 Mexico
-
 Moldova
-
 Mongolia
-
 Montenegro
-
 Morocco
-
 Mozambique
-
 Myanmar
-
 Namibia
-
 Nepal
-
 Netherlands
-
 New Zealand
-
 Nigeria
-
 North Macedonia
-
 Norway
-
 Oman
-
 Pakistan
-
 Palestine
-
 Panama
-
 Papua New Guinea
-
 Paraguay
-
 Peru
-
 Philippines
-
 Poland
-
 Portugal
-
 Puerto Rico
-
 Qatar
-
 Reunion
-
 Romania
-
 Rwanda
-
 Saudi Arabia
-
 Serbia
-
 Singapore
-
 Slovakia
-
 Slovenia
-
 Somalia
-
 South Africa
-
 Spain
-
 Sri Lanka
-
 Sweden
-
 Switzerland
-
 Syria
-
 Taiwan
-
 Tajikistan
-
 Tanzania
-
 Thailand
-
 Trinidad and Tobago
-
 Tunisia
-
 Turkey
-
 UAE
-
 Uganda
-
 Ukraine
-
 United Kingdom
-
United States
-
 Uruguay
-
 Uzbekistan
-
 Venezuela
-
 Vietnam
-
 Yemen
-
 Zambia
-
 Zimbabwe
- Forex
- Crypto












