

Persimmon stock tests GBX1,207 resistance as short-term rally loses traction

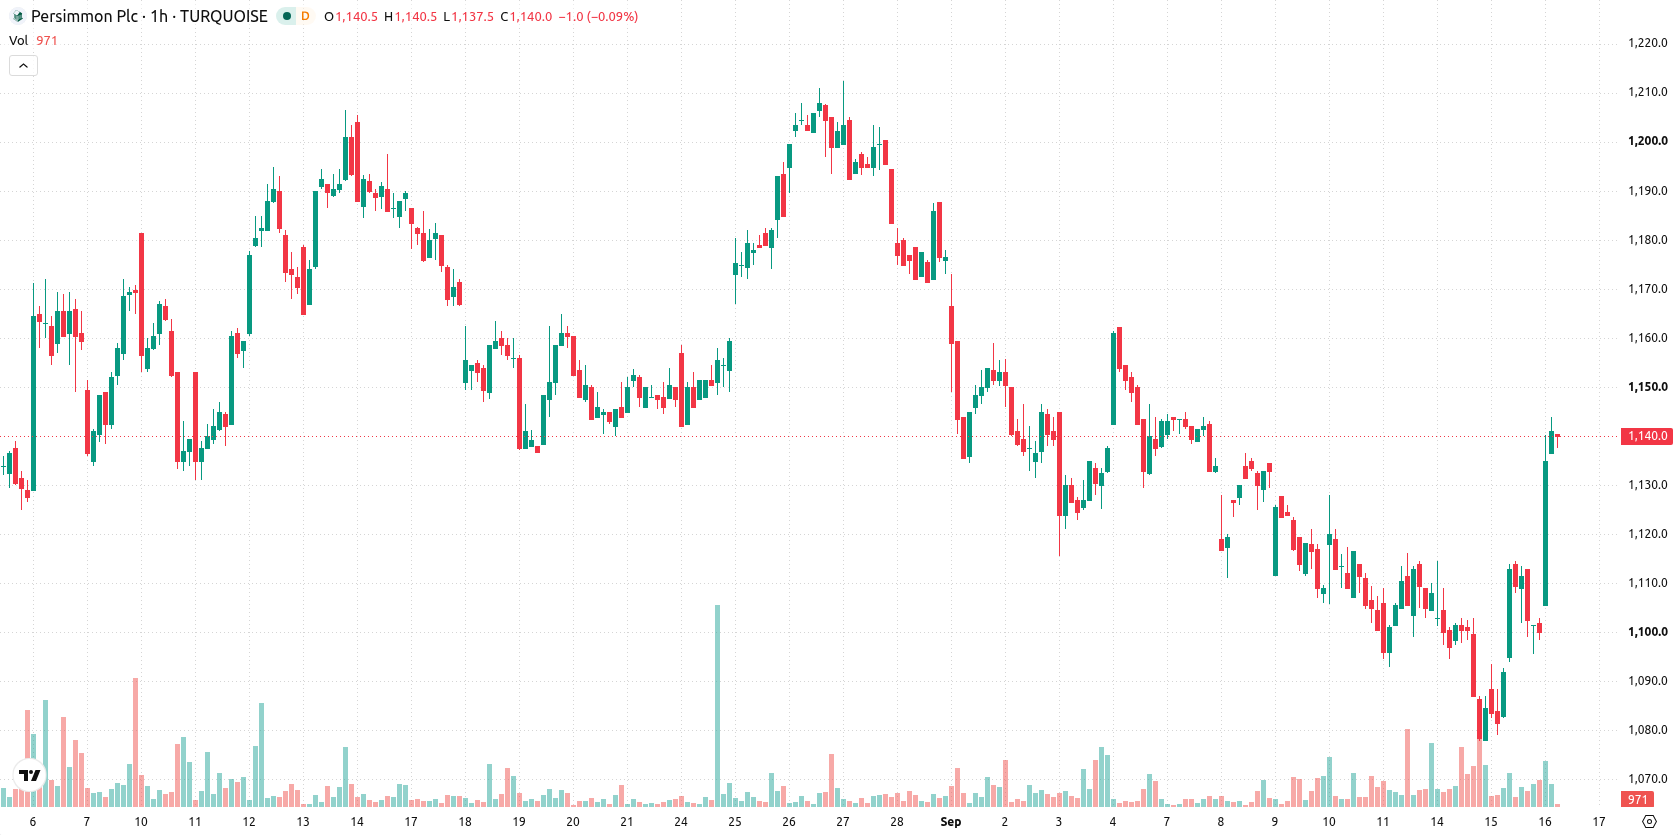
Persimmon (PSN) stock is trading at GBX1,140.5, up 3.63% on the day. The move keeps the price above its key short- and medium-term moving averages while remaining below longer-term trend indicators.
 1301.00
1342.00
Highlights
- PSN/GBX stock trades with a short- and medium-term bullish structure but remains below the long-term moving average.
- Price climbed 3.63% and closed near the session high following a 6-point gap up and elevated volatility.
- Indicators show overbought conditions and strong buyer dominance, with the price expected to consolidate between GBX1,117 and GBX1,161.
Overbought signals trigger caution despite strong buyer momentum
On the technical side, PSN/GBX trades above the MA-20 and MA-50 on the hourly chart but remains capped below the MA-200, which sits at GBX1,207. Immediate session support is defined by the Ichimoku Kijun at GBX1,110. Momentum analysis shows RSI at 69.58, with Stoch RSI, CCI, and Bull/Bear Power all indicating overbought conditions and strong buyer dominance. MACD and ADX remain neutral, while the Awesome Oscillator confirms a buying bias. However, the combination of oscillator overextension and neutral trend strength suggests a divergence that may warrant caution despite the strong intraday gains.
Bullish bias persists as momentum supports upside scenario
In the short term, PSN is expected to consolidate within a trading range of GBX1,117 to GBX1,161, representing a typical volatility band relative to current levels. There is a 75% probability of continued upward movement, with a higher likelihood for a bullish extension through resistance should momentum persist. Conversely, a break below immediate support at GBX1,110 could trigger a bearish scenario and open a move toward lower levels.
Earlier, analysts noted that Persimmon exhibited sustained bearish momentum, with downside risks dominating the technical outlook. The current analysis highlights a shift toward short-term strength, but given the overextension of momentum indicators and the potential for a break below GBX1,110 support, traders should closely monitor for signs of a reversal or range-bound consolidation.











-
 Afghanistan
-
 Albania
-
 Algeria
-
 Angola
-
 Argentina
-
 Armenia
-
 Australia
-
 Austria
-
 Azerbaijan
-
 Bahamas
-
 Bahrain
-
 Bangladesh
-
 Belarus
-
 Belgium
-
 Bolivia
-
 Botswana
-
 Brazil
-
 Brunei
-
 Bulgaria
-
 Cambodia
-
 Cameroon
-
 Canada
-
 Chile
-
 China
-
 Colombia
-
 Congo
-
 Costa Rica
-
 Cote d'Ivoire
-
 Croatia
-
 Cuba
-
 Cyprus
-
 Czechia
-
 DR Congo
-
 Denmark
-
 Dominican Republic
-
 Ecuador
-
 Egypt
-
 El Salvador
-
 Estonia
-
 Eswatini
-
 Ethiopia
-
 Finland
-
 France
-
 Georgia
-
 Germany
-
 Ghana
-
 Greece
-
 Haiti
-
 Hong Kong
-
 Hungary
-
 India
-
 Indonesia
-
 Iran, Islamic republic
-
 Iraq
-
 Ireland
-
 Israel
-
 Italy
-
 Jamaica
-
 Japan
-
 Jordan
-
 Kazakhstan
-
 Kenya
-
 Korea
-
 Kuwait
-
 Kyrgyzstan
-
 Laos
-
 Latvia
-
 Lebanon
-
 Lesotho
-
 Libya
-
 Lithuania
-
 Luxembourg
-
 Madagascar
-
 Malaysia
-
 Malta
-
 Mauritius
-
 Mexico
-
 Moldova
-
 Mongolia
-
 Montenegro
-
 Morocco
-
 Mozambique
-
 Myanmar
-
 Namibia
-
 Nepal
-
 Netherlands
-
 New Zealand
-
 Nigeria
-
 North Macedonia
-
 Norway
-
 Oman
-
 Pakistan
-
 Palestine
-
 Panama
-
 Papua New Guinea
-
 Paraguay
-
 Peru
-
 Philippines
-
 Poland
-
 Portugal
-
 Puerto Rico
-
 Qatar
-
 Reunion
-
 Romania
-
 Rwanda
-
 Saudi Arabia
-
 Serbia
-
 Singapore
-
 Slovakia
-
 Slovenia
-
 Somalia
-
 South Africa
-
 Spain
-
 Sri Lanka
-
 Sweden
-
 Switzerland
-
 Syria
-
 Taiwan
-
 Tajikistan
-
 Tanzania
-
 Thailand
-
 Trinidad and Tobago
-
 Tunisia
-
 Turkey
-
 UAE
-
 Uganda
-
 Ukraine
-
 United Kingdom
-
United States
-
 Uruguay
-
 Uzbekistan
-
 Venezuela
-
 Vietnam
-
 Yemen
-
 Zambia
-
 Zimbabwe
- Forex
- Crypto












