


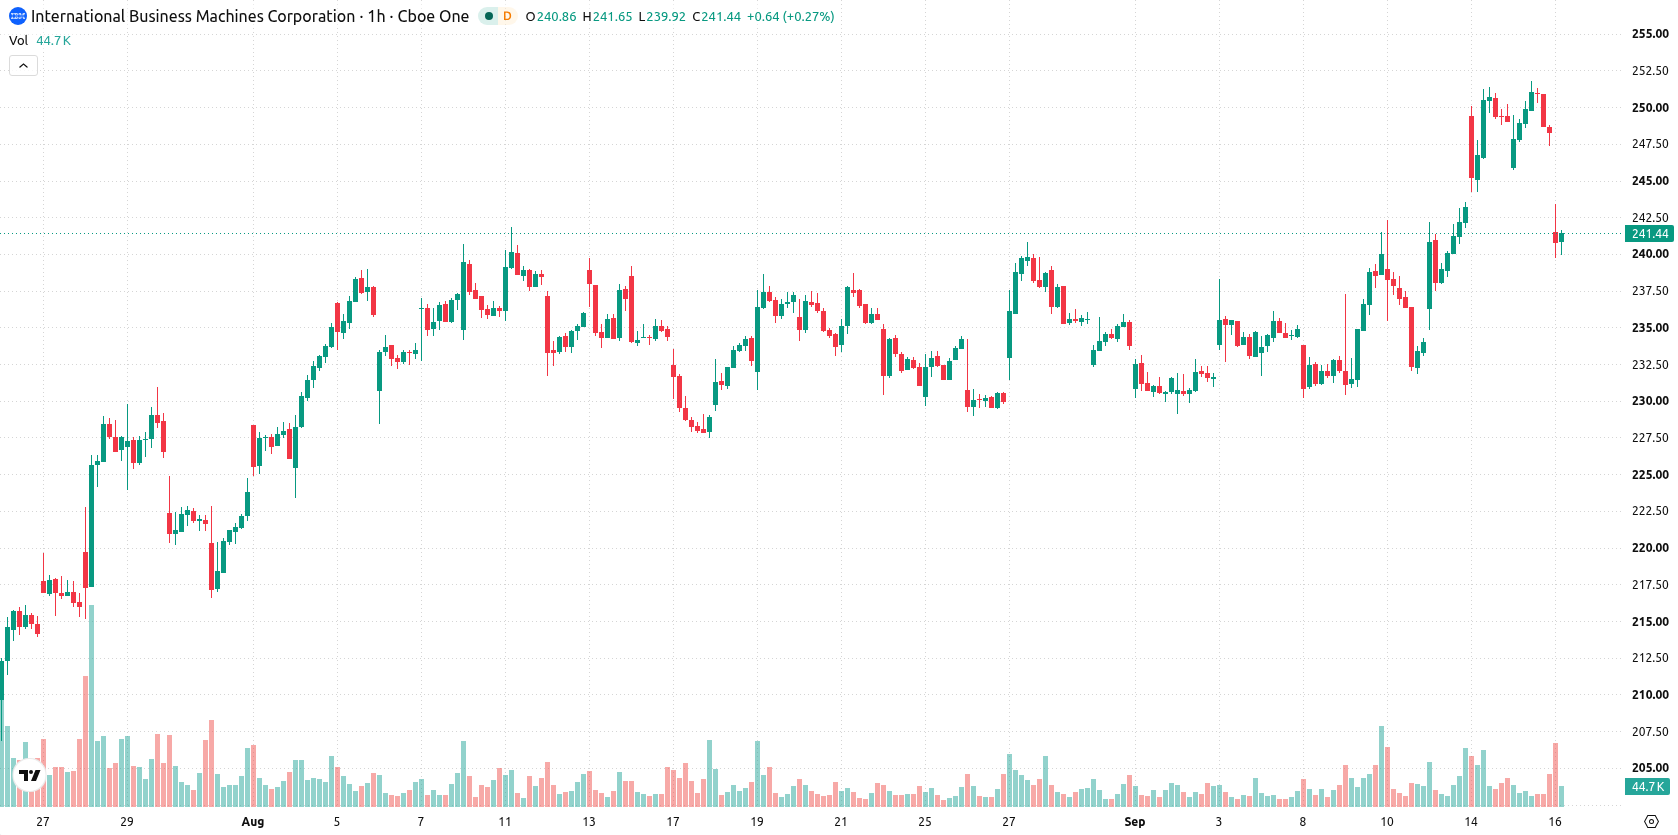
IBM (IBM) stock is trading at $240.41, marking a daily decline of 3.2%. The price currently sits below its key short-term averages and is positioned between intermediate and long-term trend levels.
 259.59
Highlights
- IBM stock faces short- and long-term selling pressure, trading below key moving averages with intermediate support holding for now.
- Momentum indicators produce conflicting signals as some show renewed buying interest and oversold conditions, while others stay neutral or overbought.
- Shares are projected to consolidate between $231.52 and $251.30 in the coming days with a 60% probability of upward movement.
Mixed momentum as bullish signals clash with oversold oscillators
On the technical side, IBM trades below the MA-20 but remains above the MA-50 on the hourly chart, while still positioned below the MA-200 on the daily timeframe. The Ichimoku Kijun at $241.81 now serves as immediate resistance. Momentum indicators offer a mixed view: both MACD and ADX signal renewed buying interest, RSI is on a Buy bias, and Stoch RSI indicates oversold conditions that suggest the recent downturn may be overextended. CCI stands neutral, while Bull/Bear Power is in overbought territory—hinting intraday buyers are active although the Awesome Oscillator remains neutral. The divergence between oversold oscillators and bullish momentum metrics highlights short-term market uncertainty.
Consolidation favored amid volatility and bullish tilt
Over the next several days, IBM is expected to trade within a volatility band from $231.52 to $251.30. The baseline scenario favors consolidation within this corridor. There is a 60% probability for upward movement, with a less likely 40% chance of a downward break. If bullish momentum prevails and the price moves above immediate resistance, further gains could follow. Conversely, a sustained drop below support may open the way for deeper declines.
Earlier, analysts noted that IBM was displaying stretched bullish momentum and faced potential consolidation as shares approached key resistance. The current technical setup adds a new dimension by revealing mixed signals and heightened uncertainty, making it important to watch if a break above $241.81 can drive a move toward the upper end of the expected volatility band.










-
 Afghanistan
-
 Albania
-
 Algeria
-
 Angola
-
 Argentina
-
 Armenia
-
 Australia
-
 Austria
-
 Azerbaijan
-
 Bahamas
-
 Bahrain
-
 Bangladesh
-
 Belarus
-
 Belgium
-
 Bolivia
-
 Botswana
-
 Brazil
-
 Brunei
-
 Bulgaria
-
 Cambodia
-
 Cameroon
-
 Canada
-
 Chile
-
 China
-
 Colombia
-
 Congo
-
 Costa Rica
-
 Cote d'Ivoire
-
 Croatia
-
 Cuba
-
 Cyprus
-
 Czechia
-
 DR Congo
-
 Denmark
-
 Dominican Republic
-
 Ecuador
-
 Egypt
-
 El Salvador
-
 Estonia
-
 Eswatini
-
 Ethiopia
-
 Finland
-
 France
-
 Georgia
-
 Germany
-
 Ghana
-
 Greece
-
 Haiti
-
 Hong Kong
-
 Hungary
-
 India
-
 Indonesia
-
 Iran, Islamic republic
-
 Iraq
-
 Ireland
-
 Israel
-
 Italy
-
 Jamaica
-
 Japan
-
 Jordan
-
 Kazakhstan
-
 Kenya
-
 Korea
-
 Kuwait
-
 Kyrgyzstan
-
 Laos
-
 Latvia
-
 Lebanon
-
 Lesotho
-
 Libya
-
 Lithuania
-
 Luxembourg
-
 Madagascar
-
 Malaysia
-
 Malta
-
 Mauritius
-
 Mexico
-
 Moldova
-
 Mongolia
-
 Montenegro
-
 Morocco
-
 Mozambique
-
 Myanmar
-
 Namibia
-
 Nepal
-
 Netherlands
-
 New Zealand
-
 Nigeria
-
 North Macedonia
-
 Norway
-
 Oman
-
 Pakistan
-
 Palestine
-
 Panama
-
 Papua New Guinea
-
 Paraguay
-
 Peru
-
 Philippines
-
 Poland
-
 Portugal
-
 Puerto Rico
-
 Qatar
-
 Reunion
-
 Romania
-
 Rwanda
-
 Saudi Arabia
-
 Serbia
-
 Singapore
-
 Slovakia
-
 Slovenia
-
 Somalia
-
 South Africa
-
 Spain
-
 Sri Lanka
-
 Sweden
-
 Switzerland
-
 Syria
-
 Taiwan
-
 Tajikistan
-
 Tanzania
-
 Thailand
-
 Trinidad and Tobago
-
 Tunisia
-
 Turkey
-
 UAE
-
 Uganda
-
 Ukraine
-
 United Kingdom
-
United States
-
 Uruguay
-
 Uzbekistan
-
 Venezuela
-
 Vietnam
-
 Yemen
-
 Zambia
-
 Zimbabwe
- Forex
- Crypto












