

Why is Schlumberger stock down today? Seller pressure mounts, key support levels to watch

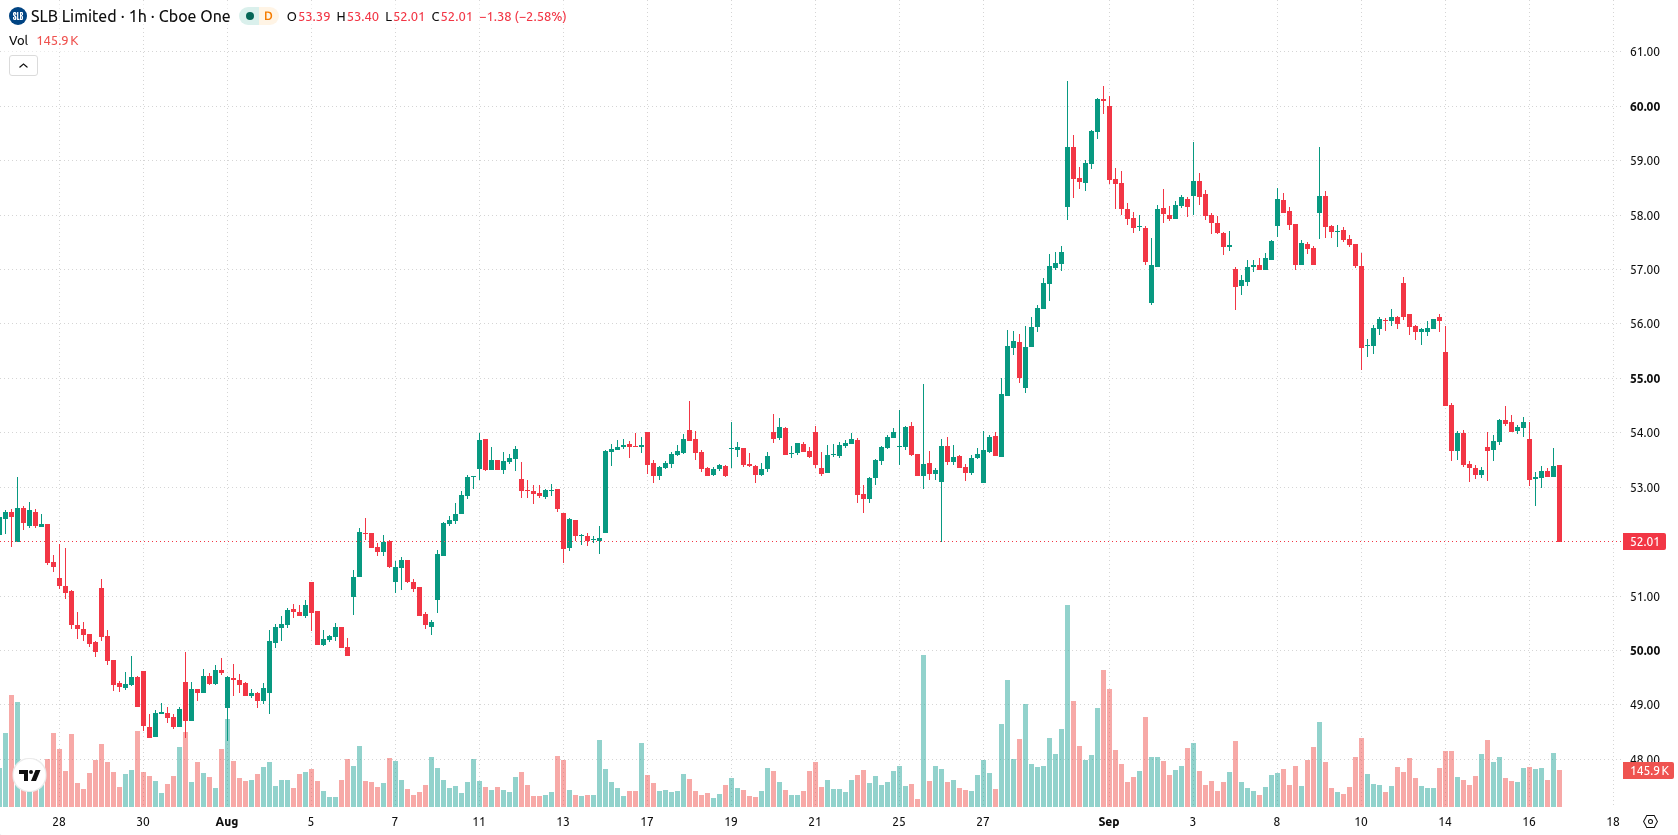
Schlumberger (SLB) stock is trading at $51.69, down 4.55% for the day and closing near its session low. The daily decline leaves the price below key short- and medium-term moving averages while still holding above its major long-term trend level.
 48.23
51.22
Highlights
- SLB/USD trades firmly below short- and medium-term moving averages, indicating sustained seller control over the near term.
- Momentum signals are mostly bearish, with very weak price action and indicators such as MACD and RSI confirming selling dominance.
- The price is expected to range between $50.01 and $53.37, with a strong probability of continued downside barring a decisive move above $54.76.
Bearish momentum grows as resistance limits upside and volatility spikes
SLB is trading below the MA-20 ($54.07) and MA-50 ($55.78), but remains above MA-200 ($49.65). The Ichimoku Kijun at $54.76 defines immediate resistance. Indicators present weak momentum: MACD stands at Strong Sell, ADX is Neutral, RSI signals Sell, Stochastic RSI is Overbought, CCI points to Sell, and Bull/Bear Power is Oversold. The Awesome Oscillator supports bears, and price action hovers close to the session’s low amid increased volatility.
Elevated downside risk as consolidation narrows breakout potential
Over the next several sessions, SLB is expected to consolidate between $50.01 and $53.37, reflecting a typical volatility band relative to current levels. The likelihood of an upward breakout is very low, while downside risk remains elevated. If buyers reclaim resistance above $54.76, a recovery scenario could emerge, but if the price falls below $50.01, a deeper decline is likely.
Earlier, analysts noted that Schlumberger was entering a period of heightened downside risk as technical momentum shifted to the bearish side. The latest market action reinforces this negative bias, with weak momentum prevailing and $50.01 now serving as an important support level for traders to monitor.






Latest Schlumberger News




-
 Afghanistan
-
 Albania
-
 Algeria
-
 Angola
-
 Argentina
-
 Armenia
-
 Australia
-
 Austria
-
 Azerbaijan
-
 Bahamas
-
 Bahrain
-
 Bangladesh
-
 Belarus
-
 Belgium
-
 Bolivia
-
 Botswana
-
 Brazil
-
 Brunei
-
 Bulgaria
-
 Cambodia
-
 Cameroon
-
 Canada
-
 Chile
-
 China
-
 Colombia
-
 Congo
-
 Costa Rica
-
 Cote d'Ivoire
-
 Croatia
-
 Cuba
-
 Cyprus
-
 Czechia
-
 DR Congo
-
 Denmark
-
 Dominican Republic
-
 Ecuador
-
 Egypt
-
 El Salvador
-
 Estonia
-
 Eswatini
-
 Ethiopia
-
 Finland
-
 France
-
 Georgia
-
 Germany
-
 Ghana
-
 Greece
-
 Haiti
-
 Hong Kong
-
 Hungary
-
 India
-
 Indonesia
-
 Iran, Islamic republic
-
 Iraq
-
 Ireland
-
 Israel
-
 Italy
-
 Jamaica
-
 Japan
-
 Jordan
-
 Kazakhstan
-
 Kenya
-
 Korea
-
 Kuwait
-
 Kyrgyzstan
-
 Laos
-
 Latvia
-
 Lebanon
-
 Lesotho
-
 Libya
-
 Lithuania
-
 Luxembourg
-
 Madagascar
-
 Malaysia
-
 Malta
-
 Mauritius
-
 Mexico
-
 Moldova
-
 Mongolia
-
 Montenegro
-
 Morocco
-
 Mozambique
-
 Myanmar
-
 Namibia
-
 Nepal
-
 Netherlands
-
 New Zealand
-
 Nigeria
-
 North Macedonia
-
 Norway
-
 Oman
-
 Pakistan
-
 Palestine
-
 Panama
-
 Papua New Guinea
-
 Paraguay
-
 Peru
-
 Philippines
-
 Poland
-
 Portugal
-
 Puerto Rico
-
 Qatar
-
 Reunion
-
 Romania
-
 Rwanda
-
 Saudi Arabia
-
 Serbia
-
 Singapore
-
 Slovakia
-
 Slovenia
-
 Somalia
-
 South Africa
-
 Spain
-
 Sri Lanka
-
 Sweden
-
 Switzerland
-
 Syria
-
 Taiwan
-
 Tajikistan
-
 Tanzania
-
 Thailand
-
 Trinidad and Tobago
-
 Tunisia
-
 Turkey
-
 UAE
-
 Uganda
-
 Ukraine
-
 United Kingdom
-
United States
-
 Uruguay
-
 Uzbekistan
-
 Venezuela
-
 Vietnam
-
 Yemen
-
 Zambia
-
 Zimbabwe
- Forex
- Crypto












