

Interactive Brokers shares technical analysis: Pullback brings focus to $79.72 support

Interactive Brokers Group, Inc. (IBKR) stock is trading at $85.3, down 3.95% for the day. The price is currently positioned below its main short- and medium-term moving averages, while holding above its key long-term measures.
 83.78
83.78
Highlights
- Interactive Brokers now enables US investors to trade directly from X Cashtags, making platform access more seamless.
- The integration offers incentives for new account sign-ups and funding to attract additional retail participation.
- Shares of Interactive Brokers fell 3.95% to $85.3, with technical signals indicating strong short-term downside risk and an expected range of $83.2 to $88.82 over the next three days.
Retail trading push as X Cashtags integration meets selling pressure
Interactive Brokers has announced a new integration with X Cashtags, enabling US investors to transition seamlessly from financial discussions on X to executing trades directly on the Interactive Brokers platform, according to Fxnewsgroup. This initiative aims to lower the barriers for potential clients by allowing trading directly from ticker pages on X, coupled with incentives to spur new account sign-ups and funding. While the move may increase retail engagement and drive future trading activity, price action has remained under broader selling pressure.
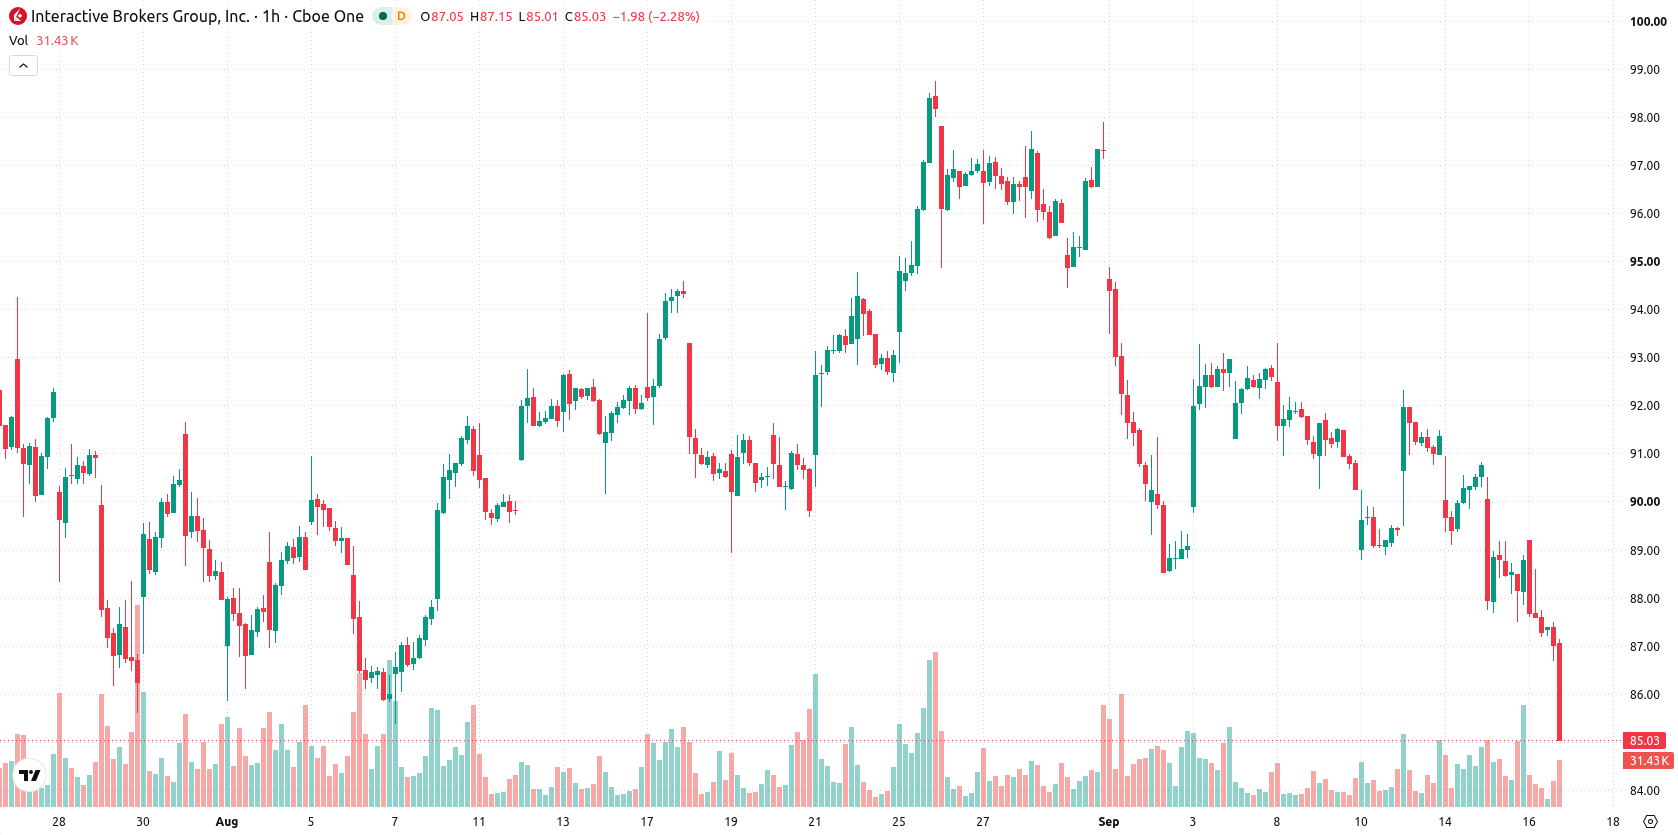
Downside momentum confirmed as daily support holds and oscillators oversold
On the hourly chart, IBKR is trading below the MA-20 at $89.67 and MA-50 at $90.57, while on the daily view it remains above the MA-200 at $79.72. The immediate upside cap is marked by the Ichimoku Kijun level at $89.79. MACD, ADX, and RSI at 35.04 all confirm negative momentum, with Stoch RSI and CCI signaling oversold conditions. Bull/Bear Power indicates continued seller dominance intraday, while the Awesome Oscillator does not lend directional confirmation.
Downside favored as volatility bands confine short-term potential
Over the next 2–3 trading days, IBKR is forecast to fluctuate within a volatility band of $83.2 to $88.82. Given the current technical evidence, there is a 21% chance of a short-term upward move, with downside continuation assigned a much higher probability of 79%. Baseline scenario anticipates trendless movement within the lower range, while an upward break above $89.79 would open the door to renewed buying, and a slide below $83.2 could amplify selling momentum.
Previously it was reported that Interactive Brokers exhibited persistent bearish momentum with a sideways bias forecast in the near term. The latest technical indications and new product integration reinforce this cautious outlook, with traders advised to monitor the $83.2 support and $89.79 resistance for possible breakout signals.






Latest Interactive Brokers News





-
 Afghanistan
-
 Albania
-
 Algeria
-
 Angola
-
 Argentina
-
 Armenia
-
 Australia
-
 Austria
-
 Azerbaijan
-
 Bahamas
-
 Bahrain
-
 Bangladesh
-
 Belarus
-
 Belgium
-
 Bolivia
-
 Botswana
-
 Brazil
-
 Brunei
-
 Bulgaria
-
 Cambodia
-
 Cameroon
-
 Canada
-
 Chile
-
 China
-
 Colombia
-
 Congo
-
 Costa Rica
-
 Cote d'Ivoire
-
 Croatia
-
 Cuba
-
 Cyprus
-
 Czechia
-
 DR Congo
-
 Denmark
-
 Dominican Republic
-
 Ecuador
-
 Egypt
-
 El Salvador
-
 Estonia
-
 Eswatini
-
 Ethiopia
-
 Finland
-
 France
-
 Georgia
-
 Germany
-
 Ghana
-
 Greece
-
 Haiti
-
 Hong Kong
-
 Hungary
-
 India
-
 Indonesia
-
 Iran, Islamic republic
-
 Iraq
-
 Ireland
-
 Israel
-
 Italy
-
 Jamaica
-
 Japan
-
 Jordan
-
 Kazakhstan
-
 Kenya
-
 Korea
-
 Kuwait
-
 Kyrgyzstan
-
 Laos
-
 Latvia
-
 Lebanon
-
 Lesotho
-
 Libya
-
 Lithuania
-
 Luxembourg
-
 Madagascar
-
 Malaysia
-
 Malta
-
 Mauritius
-
 Mexico
-
 Moldova
-
 Mongolia
-
 Montenegro
-
 Morocco
-
 Mozambique
-
 Myanmar
-
 Namibia
-
 Nepal
-
 Netherlands
-
 New Zealand
-
 Nigeria
-
 North Macedonia
-
 Norway
-
 Oman
-
 Pakistan
-
 Palestine
-
 Panama
-
 Papua New Guinea
-
 Paraguay
-
 Peru
-
 Philippines
-
 Poland
-
 Portugal
-
 Puerto Rico
-
 Qatar
-
 Reunion
-
 Romania
-
 Rwanda
-
 Saudi Arabia
-
 Serbia
-
 Singapore
-
 Slovakia
-
 Slovenia
-
 Somalia
-
 South Africa
-
 Spain
-
 Sri Lanka
-
 Sweden
-
 Switzerland
-
 Syria
-
 Taiwan
-
 Tajikistan
-
 Tanzania
-
 Thailand
-
 Trinidad and Tobago
-
 Tunisia
-
 Turkey
-
 UAE
-
 Uganda
-
 Ukraine
-
 United Kingdom
-
United States
-
 Uruguay
-
 Uzbekistan
-
 Venezuela
-
 Vietnam
-
 Yemen
-
 Zambia
-
 Zimbabwe
- Forex
- Crypto












