

Breakout attempt at $96.3 resistance: Can Interactive Brokers stock extend gains?

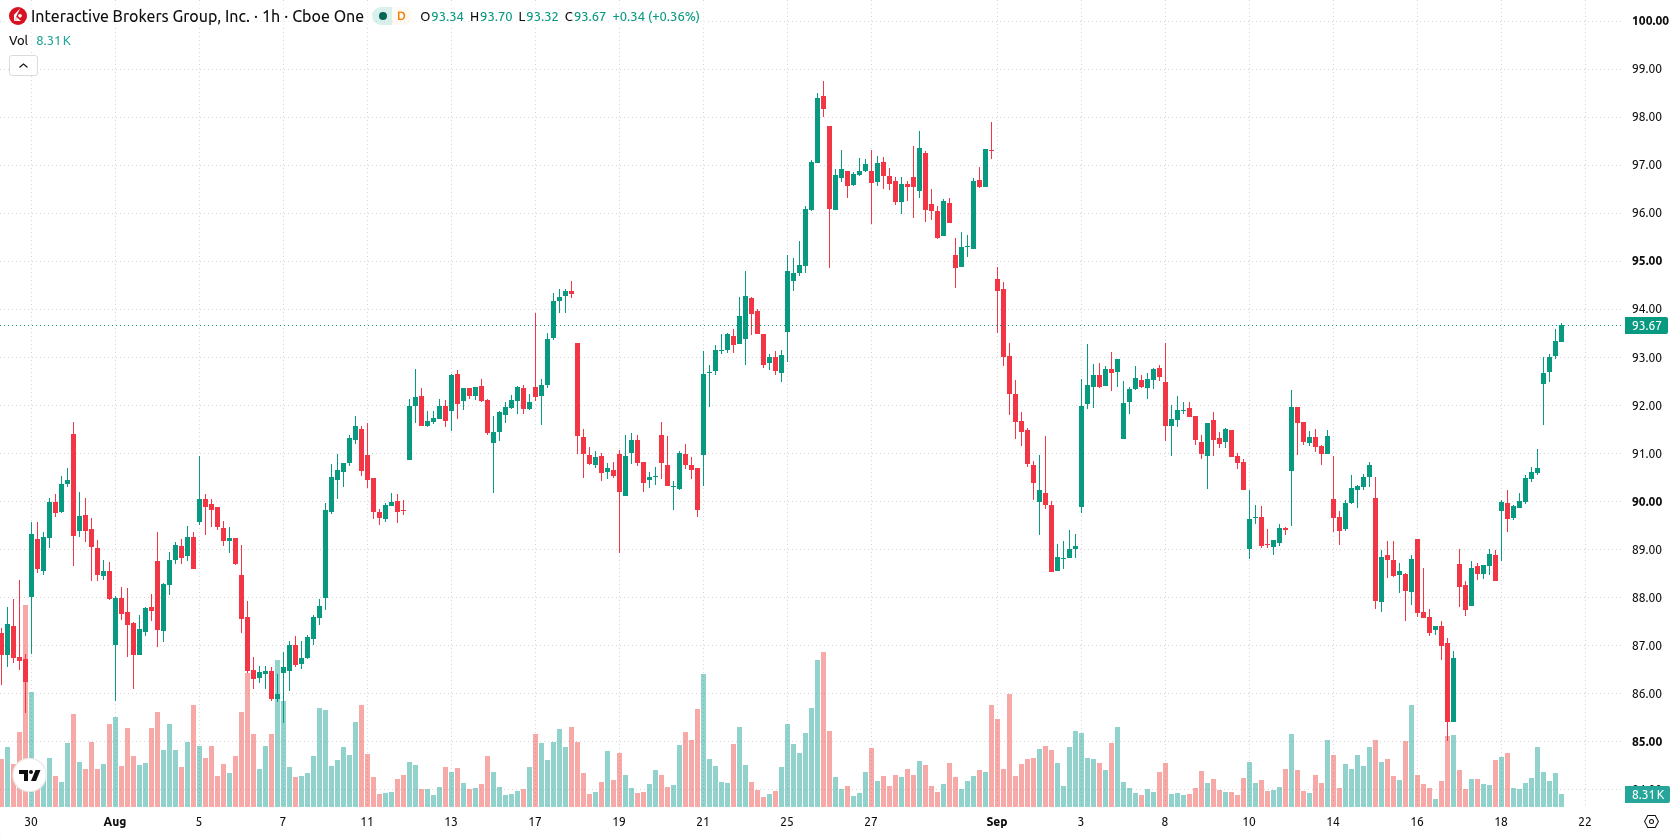
Interactive Brokers (IBKR) stock is trading at $93.65, advancing 3.29% in today’s session. The price sits above its key moving averages, reflecting near-term momentum and strength versus recent trend levels.
 83.78
83.78
Highlights
- IBKR/USD is in a bullish technical structure across all timeframes, trading above key moving averages.
- Momentum indicators show strong buying pressure, but multiple overbought oscillators suggest near-term upward exhaustion risk.
- Price is at $93.65 with an expected four-day trading range of $90.41 to $96.3 and a 78% probability of an upward move.
Bullish momentum signals intensify as overbought readings emerge
IBKR is trading above its MA-20 ($88.59), MA-50 ($89.31), and MA-200 ($80.09). The Ichimoku Kijun at $87.97 provides the closest support level, while momentum indicators reinforce the bullish environment: RSI at 61.34 and a positive MACD signal both confirm buyer dominance, though the ADX remains neutral. Stoch RSI, CCI, and Bull/Bear Power have reached overbought territory, flagging stretched intraday conditions. Awesome Oscillator readings also support the prevailing bullish momentum.
Consolidation favored as volatility band defines breakout risks
Over the next four days, IBKR is expected to trade within a typical volatility band of $90.41 to $96.3. With upward movement probability estimated at 78%, the most likely outcome is for the price to consolidate between these support and resistance levels. A break above $96.3 could trigger renewed buying into higher ground, while a sustained move below $90.41 would increase the risk of deeper pullbacks.
Earlier, analysts noted that exchange rule revisions and infrastructure innovations—such as wider bid-ask spreads and advances in tokenization—were enhancing flexibility for liquidity providers and platforms positioned to handle new product structures. The current technical setup for Interactive Brokers, highlighted by strengthening momentum and price positioning above multiple moving averages, presents an actionable volatility band in the $90.41–$96.30 range for traders monitoring breakout or pullback opportunities.






Latest Interactive Brokers News




-
 Afghanistan
-
 Albania
-
 Algeria
-
 Angola
-
 Argentina
-
 Armenia
-
 Australia
-
 Austria
-
 Azerbaijan
-
 Bahamas
-
 Bahrain
-
 Bangladesh
-
 Belarus
-
 Belgium
-
 Bolivia
-
 Botswana
-
 Brazil
-
 Brunei
-
 Bulgaria
-
 Cambodia
-
 Cameroon
-
 Canada
-
 Chile
-
 China
-
 Colombia
-
 Congo
-
 Costa Rica
-
 Cote d'Ivoire
-
 Croatia
-
 Cuba
-
 Cyprus
-
 Czechia
-
 DR Congo
-
 Denmark
-
 Dominican Republic
-
 Ecuador
-
 Egypt
-
 El Salvador
-
 Estonia
-
 Eswatini
-
 Ethiopia
-
 Finland
-
 France
-
 Georgia
-
 Germany
-
 Ghana
-
 Greece
-
 Haiti
-
 Hong Kong
-
 Hungary
-
 India
-
 Indonesia
-
 Iran, Islamic republic
-
 Iraq
-
 Ireland
-
 Israel
-
 Italy
-
 Jamaica
-
 Japan
-
 Jordan
-
 Kazakhstan
-
 Kenya
-
 Korea
-
 Kuwait
-
 Kyrgyzstan
-
 Laos
-
 Latvia
-
 Lebanon
-
 Lesotho
-
 Libya
-
 Lithuania
-
 Luxembourg
-
 Madagascar
-
 Malaysia
-
 Malta
-
 Mauritius
-
 Mexico
-
 Moldova
-
 Mongolia
-
 Montenegro
-
 Morocco
-
 Mozambique
-
 Myanmar
-
 Namibia
-
 Nepal
-
 Netherlands
-
 New Zealand
-
 Nigeria
-
 North Macedonia
-
 Norway
-
 Oman
-
 Pakistan
-
 Palestine
-
 Panama
-
 Papua New Guinea
-
 Paraguay
-
 Peru
-
 Philippines
-
 Poland
-
 Portugal
-
 Puerto Rico
-
 Qatar
-
 Reunion
-
 Romania
-
 Rwanda
-
 Saudi Arabia
-
 Serbia
-
 Singapore
-
 Slovakia
-
 Slovenia
-
 Somalia
-
 South Africa
-
 Spain
-
 Sri Lanka
-
 Sweden
-
 Switzerland
-
 Syria
-
 Taiwan
-
 Tajikistan
-
 Tanzania
-
 Thailand
-
 Trinidad and Tobago
-
 Tunisia
-
 Turkey
-
 UAE
-
 Uganda
-
 Ukraine
-
 United Kingdom
-
United States
-
 Uruguay
-
 Uzbekistan
-
 Venezuela
-
 Vietnam
-
 Yemen
-
 Zambia
-
 Zimbabwe
- Forex
- Crypto












