

What's behind JetBlue Airways's latest 4.0% stock surge?

JetBlue Airways Corp (JBLU) surged 4.00% as intraday volatility and a move toward session highs drew buyers, with a strong gap open providing the catalyst for the day's advance. The rebound looks limited, with JBLU still trading below its 20-day, 50-day, and 200-day moving averages.
 3.23
3.23
Highlights
- JetBlue Airways stock trades below short, medium, and long-term moving averages, indicating sustained downward pressure from sellers.
- Momentum indicators including MACD, RSI, CCI, and Bull/Bear Power issue sell signals, forecasting continued selling activity and weak trend strength.
- Expected price range for the next five sessions is $4.38 to $4.71, with resistance at $4.56 and high probability of a move lower.
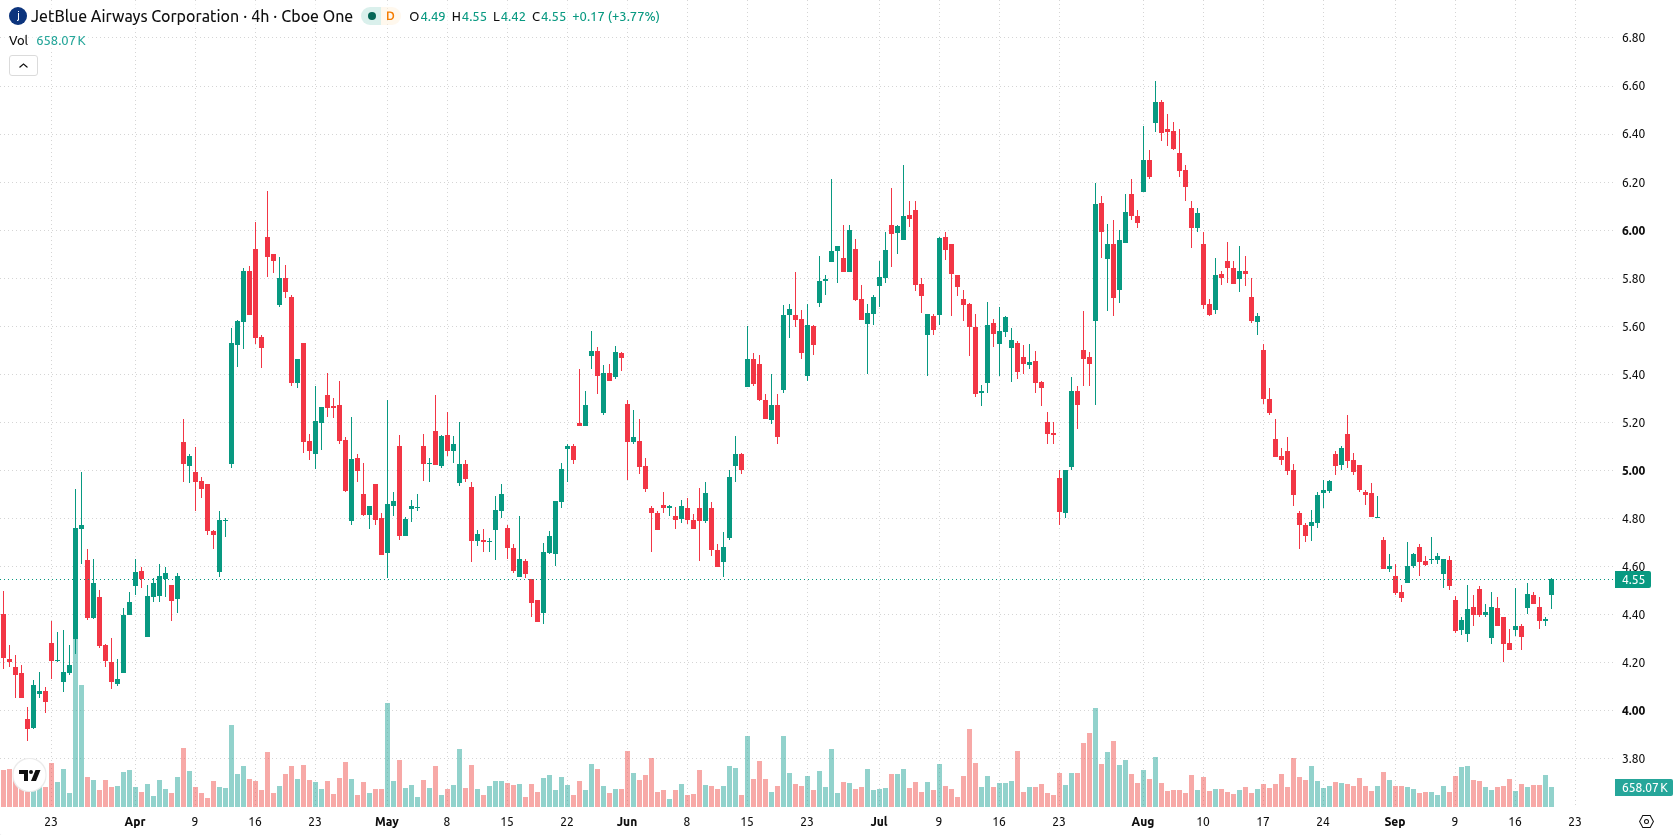
Sustained selling pressure as key averages and momentum weaken
JBLU is trading below its 20-day, 50-day, and 200-day moving averages at $4.60, $5.21, and $5.11, respectively, indicating continued pressure from sellers both short and long term. Resistance sits at the recent high of $4.56, while support is just beneath at $4.53, with the broader trend context showing a bullish alignment between the 50-day and 200-day averages. Momentum indicators, including MACD and RSI, remain firmly negative and point to persistent selling pressure, as do the CCI and BBP. BBP remains negative, highlighting dominant intraday selling, while ADX and Stochastic RSI remain neutral, suggesting a pause in trend conviction.
Earlier, analysts noted that JetBlue shares appeared range-bound as bullish signals faced meaningful resistance. The current analysis signals a shift to a more cautious outlook, with downside risk now prevailing and the $4.53 support level emerging as a critical threshold for near-term direction.









-
 Afghanistan
-
 Albania
-
 Algeria
-
 Angola
-
 Argentina
-
 Armenia
-
 Australia
-
 Austria
-
 Azerbaijan
-
 Bahamas
-
 Bahrain
-
 Bangladesh
-
 Belarus
-
 Belgium
-
 Bolivia
-
 Botswana
-
 Brazil
-
 Brunei
-
 Bulgaria
-
 Cambodia
-
 Cameroon
-
 Canada
-
 Chile
-
 China
-
 Colombia
-
 Congo
-
 Costa Rica
-
 Cote d'Ivoire
-
 Croatia
-
 Cuba
-
 Cyprus
-
 Czechia
-
 DR Congo
-
 Denmark
-
 Dominican Republic
-
 Ecuador
-
 Egypt
-
 El Salvador
-
 Estonia
-
 Eswatini
-
 Ethiopia
-
 Finland
-
 France
-
 Georgia
-
 Germany
-
 Ghana
-
 Greece
-
 Haiti
-
 Hong Kong
-
 Hungary
-
 India
-
 Indonesia
-
 Iran, Islamic republic
-
 Iraq
-
 Ireland
-
 Israel
-
 Italy
-
 Jamaica
-
 Japan
-
 Jordan
-
 Kazakhstan
-
 Kenya
-
 Korea
-
 Kuwait
-
 Kyrgyzstan
-
 Laos
-
 Latvia
-
 Lebanon
-
 Lesotho
-
 Libya
-
 Lithuania
-
 Luxembourg
-
 Madagascar
-
 Malaysia
-
 Malta
-
 Mauritius
-
 Mexico
-
 Moldova
-
 Mongolia
-
 Montenegro
-
 Morocco
-
 Mozambique
-
 Myanmar
-
 Namibia
-
 Nepal
-
 Netherlands
-
 New Zealand
-
 Nigeria
-
 North Macedonia
-
 Norway
-
 Oman
-
 Pakistan
-
 Palestine
-
 Panama
-
 Papua New Guinea
-
 Paraguay
-
 Peru
-
 Philippines
-
 Poland
-
 Portugal
-
 Puerto Rico
-
 Qatar
-
 Reunion
-
 Romania
-
 Rwanda
-
 Saudi Arabia
-
 Serbia
-
 Singapore
-
 Slovakia
-
 Slovenia
-
 Somalia
-
 South Africa
-
 Spain
-
 Sri Lanka
-
 Sweden
-
 Switzerland
-
 Syria
-
 Taiwan
-
 Tajikistan
-
 Tanzania
-
 Thailand
-
 Trinidad and Tobago
-
 Tunisia
-
 Turkey
-
 UAE
-
 Uganda
-
 Ukraine
-
 United Kingdom
-
United States
-
 Uruguay
-
 Uzbekistan
-
 Venezuela
-
 Vietnam
-
 Yemen
-
 Zambia
-
 Zimbabwe
- Forex
- Crypto












