

Eli Lilly stock rises over 3% as FDA approves once-weekly insulin and new research deal announced

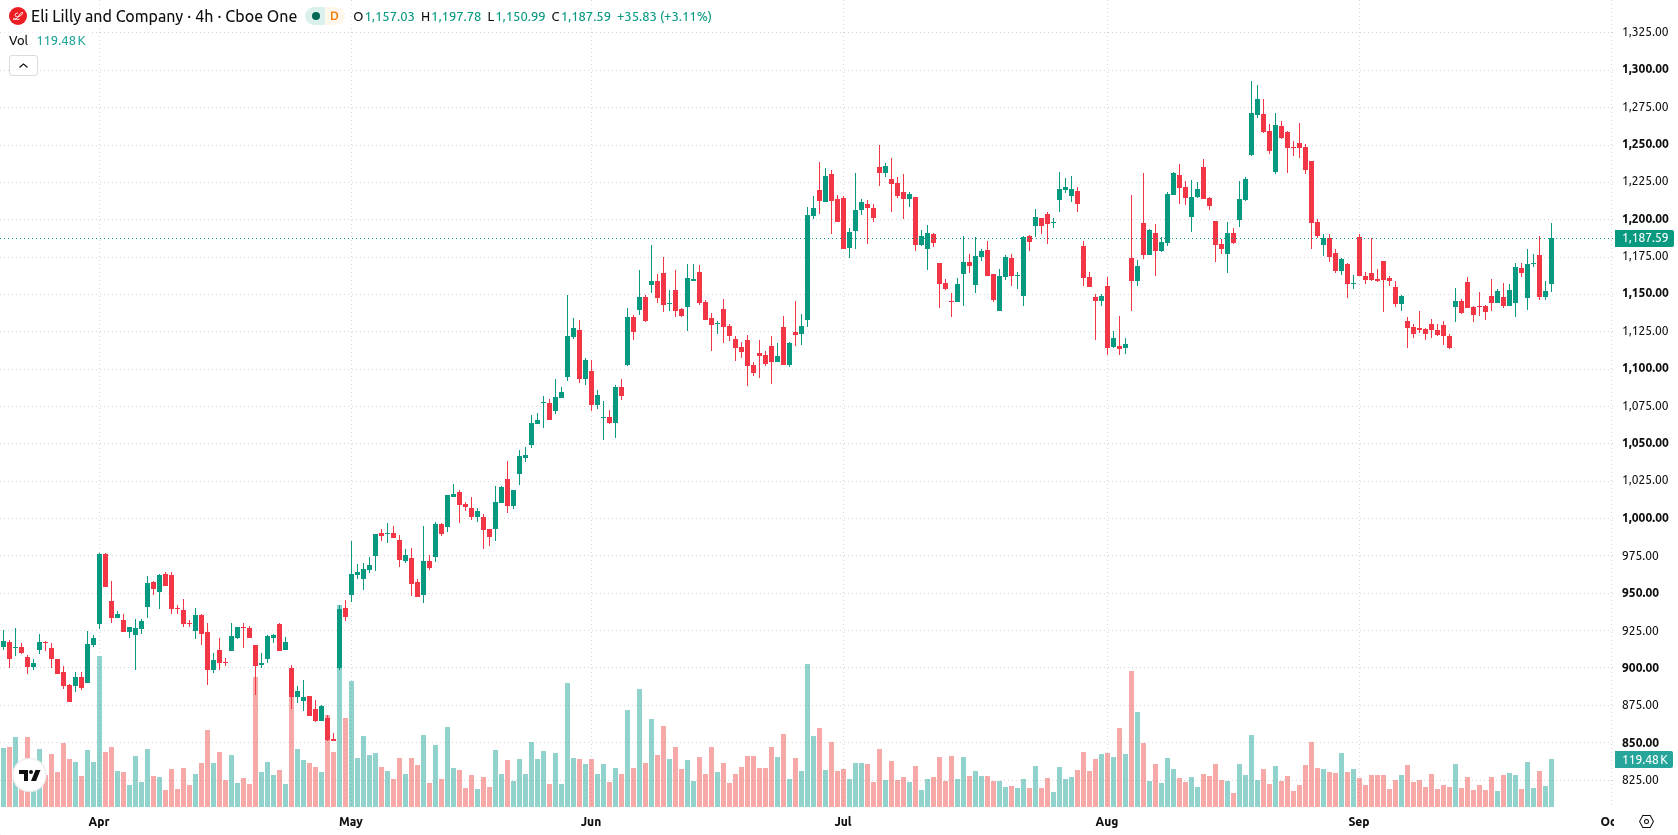
Eli Lilly and Company (LLY) climbed 3.01% after the FDA approved its once-weekly basal insulin, Onswik, for type 2 diabetes, and after confirming a new research and development collaboration. The rally is supported by the stock’s position above its 20-day, 50-day, and 200-day moving averages, though momentum signals from MACD and oscillators indicate some caution is warranted.
 1298.88
1320.59
Highlights
- The FDA approved Eli Lilly's once-weekly basal insulin Onswik for type 2 diabetes, strengthening its therapeutic portfolio.
- Eli Lilly announced annual revenue of $65.18 billion and net profit of $20.64 billion, with ongoing collaborations and acquisitions.
- Shares of Eli Lilly are in a long-term bullish trend but immediate technical indicators show potential loss of momentum, with support at $1,180, resistance at $1,197, and a projected five-day range of $1,163 to $1,209.
Product pipeline and dealmaking expand as revenue growth strengthens
The FDA approved Eli Lilly's once-weekly basal insulin, Onswik, for type 2 diabetes, bolstering its product pipeline. The company also entered a research and development collaboration and licensing agreement with InnoCare Pharma to target five unmet medical needs, featuring payments up to $3.25 billion. Additionally, Eli Lilly reported annual revenue of $65.18 billion and net profit of $20.64 billion, and expanded its reach through recent strategic partnerships and acquisitions in the pharmaceuticals sector.
Bullish price above averages as divergence emerges in technical signals
Eli Lilly is trading above its 20-day, 50-day, and 200-day moving averages ($1,150, $1,176, and $1,068 respectively), reinforcing bullish short-, medium-, and long-term momentum. Immediate technical levels show resistance at $1,197 and support at $1,180, while the long-term trend remains confirmed bullish. The MACD and Relative Strength Index (RSI) both signal a potential loss of momentum, with the MACD giving a strong sell and the RSI at 46.87 pointing toward a sell. Stochastic RSI is also bearish, and the Commodity Channel Index (CCI) remains neutral. Bull/Bear Power (BBP) is positive at 16.63, indicating that buyers currently dominate intraday momentum, but its overbought signal suggests caution. The session opened with an upside gap of about $33 (2.87%) and is now trading mid-range within the day’s volatility band of 1.58%. Daily movement shows the stock is up $34.62 (3.01%), and intraday tone is showing strength but signals from the oscillators diverge from price action, highlighting some uncertainty in the momentum.
Previously it was reported that Eli Lilly’s FDA approval for Onswik and international expansion had positioned the company for potential upside, though technical indicators reflected some short-term uncertainty. The current analysis adds that while the stock remains above key moving averages, diverging momentum signals warrant close attention to the $1,197 resistance as a pivotal level for potential breakout or consolidation.






Latest Eli Lilly and Company News



-
 Afghanistan
-
 Albania
-
 Algeria
-
 Angola
-
 Argentina
-
 Armenia
-
 Australia
-
 Austria
-
 Azerbaijan
-
 Bahamas
-
 Bahrain
-
 Bangladesh
-
 Belarus
-
 Belgium
-
 Bolivia
-
 Botswana
-
 Brazil
-
 Brunei
-
 Bulgaria
-
 Cambodia
-
 Cameroon
-
 Canada
-
 Chile
-
 China
-
 Colombia
-
 Congo
-
 Costa Rica
-
 Cote d'Ivoire
-
 Croatia
-
 Cuba
-
 Cyprus
-
 Czechia
-
 DR Congo
-
 Denmark
-
 Dominican Republic
-
 Ecuador
-
 Egypt
-
 El Salvador
-
 Estonia
-
 Eswatini
-
 Ethiopia
-
 Finland
-
 France
-
 Georgia
-
 Germany
-
 Ghana
-
 Greece
-
 Haiti
-
 Hong Kong
-
 Hungary
-
 India
-
 Indonesia
-
 Iran, Islamic republic
-
 Iraq
-
 Ireland
-
 Israel
-
 Italy
-
 Jamaica
-
 Japan
-
 Jordan
-
 Kazakhstan
-
 Kenya
-
 Korea
-
 Kuwait
-
 Kyrgyzstan
-
 Laos
-
 Latvia
-
 Lebanon
-
 Lesotho
-
 Libya
-
 Lithuania
-
 Luxembourg
-
 Madagascar
-
 Malaysia
-
 Malta
-
 Mauritius
-
 Mexico
-
 Moldova
-
 Mongolia
-
 Montenegro
-
 Morocco
-
 Mozambique
-
 Myanmar
-
 Namibia
-
 Nepal
-
 Netherlands
-
 New Zealand
-
 Nigeria
-
 North Macedonia
-
 Norway
-
 Oman
-
 Pakistan
-
 Palestine
-
 Panama
-
 Papua New Guinea
-
 Paraguay
-
 Peru
-
 Philippines
-
 Poland
-
 Portugal
-
 Puerto Rico
-
 Qatar
-
 Reunion
-
 Romania
-
 Rwanda
-
 Saudi Arabia
-
 Serbia
-
 Singapore
-
 Slovakia
-
 Slovenia
-
 Somalia
-
 South Africa
-
 Spain
-
 Sri Lanka
-
 Sweden
-
 Switzerland
-
 Syria
-
 Taiwan
-
 Tajikistan
-
 Tanzania
-
 Thailand
-
 Trinidad and Tobago
-
 Tunisia
-
 Turkey
-
 UAE
-
 Uganda
-
 Ukraine
-
 United Kingdom
-
United States
-
 Uruguay
-
 Uzbekistan
-
 Venezuela
-
 Vietnam
-
 Yemen
-
 Zambia
-
 Zimbabwe
- Forex
- Crypto












