

Can net loss of $237.2 million pressure Riot Platforms stock?

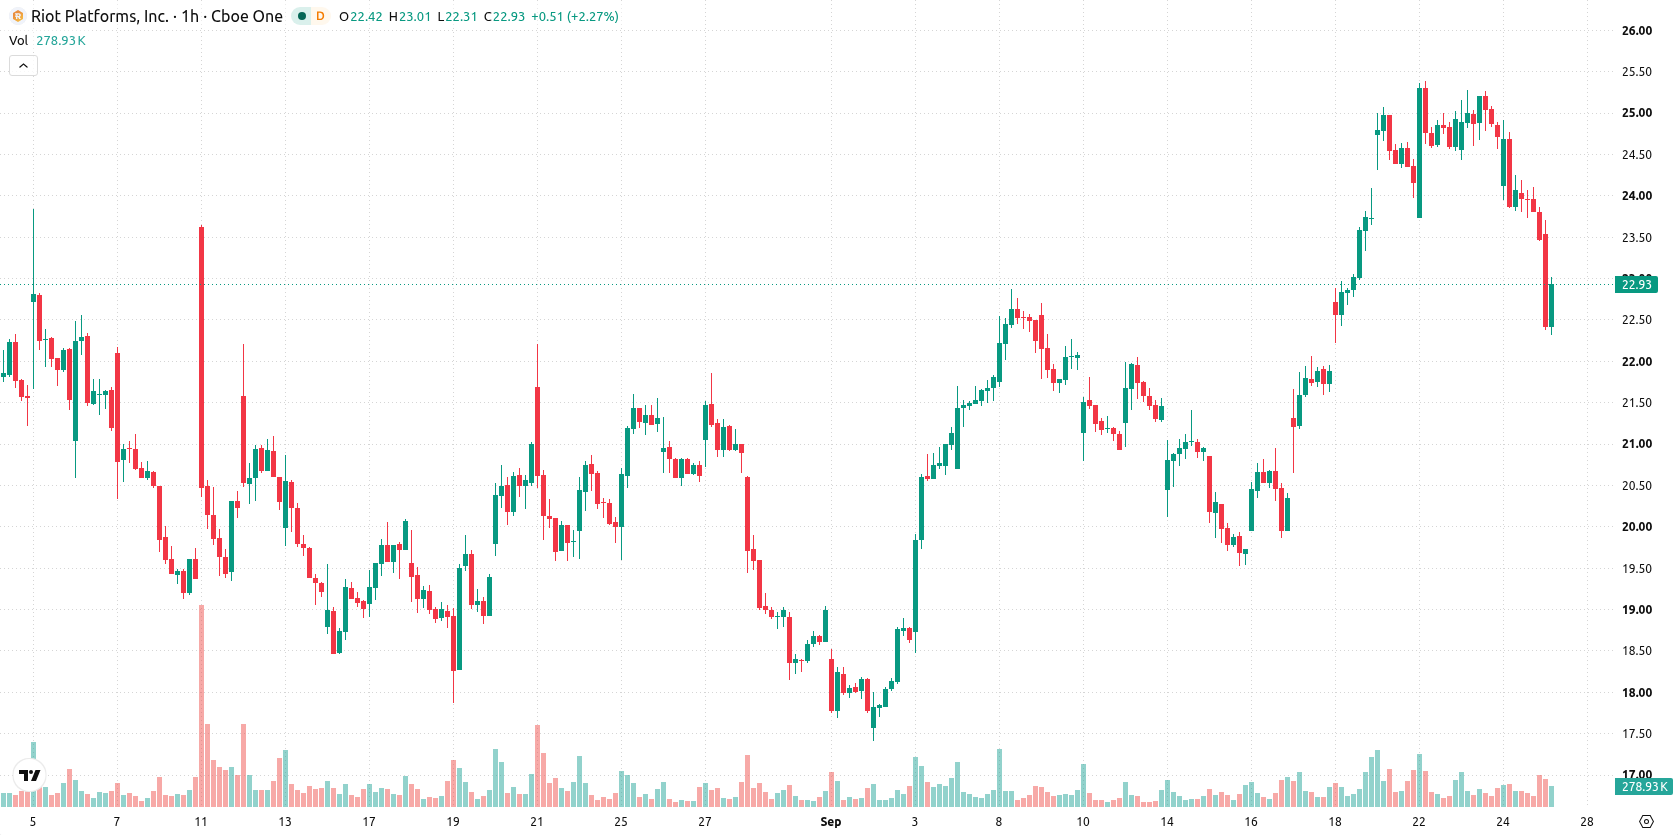
Riot Platforms (RIOT) stock is trading at $22.9, marking a daily loss of 2.66%. The price currently sits below its key short- and medium-term moving averages, while remaining above the longer-term trend indicator.
 12.92
14.44
Highlights
- Riot Platforms reported a net loss of $237.2 million for the quarter despite revenue growth to $647.4 million.
- Negative EBITDA at $138.6 million and cash outflows with free cash flow at -$176.1 million remain significant concerns for business sustainability.
- Shares of Riot Platforms traded lower to $22.9 amid bearish technical signals, with projected range of $22.08 to $23.72 and downside probability at 59%.
Losses deepen as cash burn persists despite revenue gains
Riot Platforms Inc. reported a net loss of approximately $237.2 million in its latest quarter, reinforcing ongoing challenges in achieving profitability despite multi-year revenue growth to around $647.4 million. The company's most recent financials also showed negative EBITDA of roughly $138.6 million and significant cash outflows, with operating cash flow at -$90.1 million and free cash flow at about -$176.1 million. Although Riot Platforms Inc. maintained a cash balance of $548.9 million at quarter-end, persistent unprofitable operations have heightened investor concerns over the sustainability of its current business model.
Momentum signals bearish bias as oversold indicators emerge
On the technical side, RIOT is trading below the H1 MA-20 and MA-50 but remains above the long-term MA-200. The Ichimoku Kijun at $24.44 acts as immediate resistance, with short-term support identified at $22.08 and resistance at $23.72. Among the momentum indicators, RSI is currently in sell territory, while CCI and Stochastic RSI both mark strong oversold conditions. MACD presents a neutral outlook, ADX signals a sell bias, and negative Bull/Bear Power readings further indicate seller dominance intraday. The Awesome Oscillator supports the prevailing bearish undertone, though oversold signals suggest selling may be overextended near term.
Support and resistance levels drive near-term downside risk
In the short term, RIOT is expected to trade within a corridor between $22.08 and $23.72. The current forecast scenario places a 59% probability on a further downward move, while assigning a 41% chance to an upward reversal. Baseline expectations call for continued sideways movement within this volatility band, although a break above resistance could see attempts to recover toward the $24.44 Kijun level. Conversely, loss of support below $22.08 may trigger additional downside despite prevailing oversold signals.
Earlier, analysts noted that Riot Platforms was consolidating within a well-defined range amid mixed technical signals and highlighted the potential for a directional breakout. The latest earnings-driven downside and persistent oversold readings add a new dimension of risk, with traders advised to monitor the $22.08 support for signs of either stabilization or renewed weakness in the near term.









-
 Afghanistan
-
 Albania
-
 Algeria
-
 Angola
-
 Argentina
-
 Armenia
-
 Australia
-
 Austria
-
 Azerbaijan
-
 Bahamas
-
 Bahrain
-
 Bangladesh
-
 Belarus
-
 Belgium
-
 Bolivia
-
 Botswana
-
 Brazil
-
 Brunei
-
 Bulgaria
-
 Cambodia
-
 Cameroon
-
 Canada
-
 Chile
-
 China
-
 Colombia
-
 Congo
-
 Costa Rica
-
 Cote d'Ivoire
-
 Croatia
-
 Cuba
-
 Cyprus
-
 Czechia
-
 DR Congo
-
 Denmark
-
 Dominican Republic
-
 Ecuador
-
 Egypt
-
 El Salvador
-
 Estonia
-
 Eswatini
-
 Ethiopia
-
 Finland
-
 France
-
 Georgia
-
 Germany
-
 Ghana
-
 Greece
-
 Haiti
-
 Hong Kong
-
 Hungary
-
 India
-
 Indonesia
-
 Iran, Islamic republic
-
 Iraq
-
 Ireland
-
 Israel
-
 Italy
-
 Jamaica
-
 Japan
-
 Jordan
-
 Kazakhstan
-
 Kenya
-
 Korea
-
 Kuwait
-
 Kyrgyzstan
-
 Laos
-
 Latvia
-
 Lebanon
-
 Lesotho
-
 Libya
-
 Lithuania
-
 Luxembourg
-
 Madagascar
-
 Malaysia
-
 Malta
-
 Mauritius
-
 Mexico
-
 Moldova
-
 Mongolia
-
 Montenegro
-
 Morocco
-
 Mozambique
-
 Myanmar
-
 Namibia
-
 Nepal
-
 Netherlands
-
 New Zealand
-
 Nigeria
-
 North Macedonia
-
 Norway
-
 Oman
-
 Pakistan
-
 Palestine
-
 Panama
-
 Papua New Guinea
-
 Paraguay
-
 Peru
-
 Philippines
-
 Poland
-
 Portugal
-
 Puerto Rico
-
 Qatar
-
 Reunion
-
 Romania
-
 Rwanda
-
 Saudi Arabia
-
 Serbia
-
 Singapore
-
 Slovakia
-
 Slovenia
-
 Somalia
-
 South Africa
-
 Spain
-
 Sri Lanka
-
 Sweden
-
 Switzerland
-
 Syria
-
 Taiwan
-
 Tajikistan
-
 Tanzania
-
 Thailand
-
 Trinidad and Tobago
-
 Tunisia
-
 Turkey
-
 UAE
-
 Uganda
-
 Ukraine
-
 United Kingdom
-
United States
-
 Uruguay
-
 Uzbekistan
-
 Venezuela
-
 Vietnam
-
 Yemen
-
 Zambia
-
 Zimbabwe
- Forex
- Crypto












