

Schlumberger stock support test: Technical outlook

Schlumberger (SLB) stock is trading at $49.53, reflecting a daily decline of 3.68%. The stock sits below its primary moving averages, indicating persistent downside momentum in the current session.
 50.63
51.69
Highlights
- SLB reported net income fell 5.6% to $752 million due to reduced Middle East oilfield activity from geopolitical disruptions.
- Weaker earnings and regional demand have led to additional selling in SLB stock from investors.
- SLB stock trades below key moving averages with a forecasted range of $48.52 to $50.54 and strong downside pressure likely to persist.
Earnings drop and Mideast war pressure drive investor selling
SLB reported a 5.6% drop in net income to $752 million for the latest quarter, with the decline attributed to reduced oilfield activity in the Middle East as a result of the Iran war, according to Energynow. The lower earnings highlight a direct impact from geopolitical disruptions on the company’s core operations. This combination of weaker fundamentals and softer regional demand has weighed on investor sentiment, prompting additional selling.
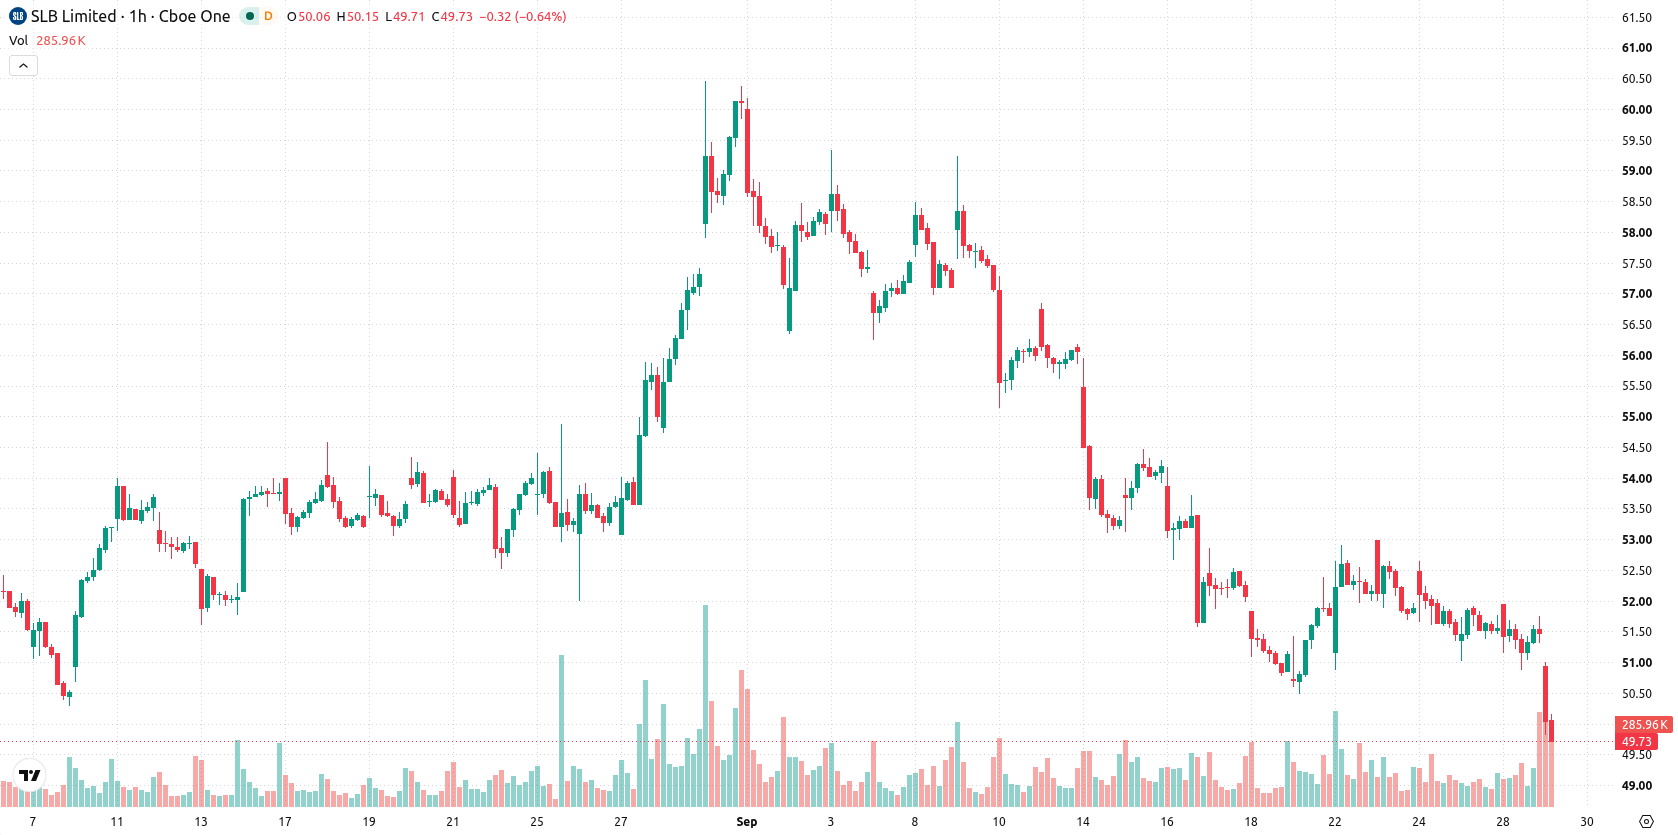
Multitimeframe weakness as major signals reinforce bearish bias
On the technical front, SLB is trading below the MA-20 and MA-50 on the H1 timeframe and also remains under the MA-200 on the daily chart, reinforcing a weak structure across timeframes. The Ichimoku Kijun level at $51.77 serves as immediate resistance. MACD signals strong sell momentum, while ADX is neutral. RSI stands at 46.03, showing modest selling pressure but not an oversold reading. Both Stoch RSI and CCI are neutral, pointing to a lack of conviction among oscillators. Bull/Bear Power indicates intraday buyer activity, but this is offset by the dominant bearish signals elsewhere. The Awesome Oscillator remains neutral and does not contribute directionally.
Limited rebound odds as volatility band contains trading
For the coming sessions, SLB is expected to consolidate within a volatility band between $48.52 and $50.54. The likelihood of a sustained rebound is low given prevailing momentum and weak technical structure. Downward breaks below $48.52 support could trigger further declines, while any bullish scenario would require a move above the immediate $51.77 resistance.
Earlier, analysts noted that Schlumberger faced heightened downside risk as technical momentum shifted to the bearish side. With the latest quarterly earnings confirming weaker fundamentals and downside momentum still in place, traders should monitor the $48.52 support level as a potential trigger for further declines.






Latest Schlumberger News




-
 Afghanistan
-
 Albania
-
 Algeria
-
 Angola
-
 Argentina
-
 Armenia
-
 Australia
-
 Austria
-
 Azerbaijan
-
 Bahamas
-
 Bahrain
-
 Bangladesh
-
 Belarus
-
 Belgium
-
 Bolivia
-
 Botswana
-
 Brazil
-
 Brunei
-
 Bulgaria
-
 Cambodia
-
 Cameroon
-
 Canada
-
 Chile
-
 China
-
 Colombia
-
 Congo
-
 Costa Rica
-
 Cote d'Ivoire
-
 Croatia
-
 Cuba
-
 Cyprus
-
 Czechia
-
 DR Congo
-
 Denmark
-
 Dominican Republic
-
 Ecuador
-
 Egypt
-
 El Salvador
-
 Estonia
-
 Eswatini
-
 Ethiopia
-
 Finland
-
 France
-
 Georgia
-
 Germany
-
 Ghana
-
 Greece
-
 Haiti
-
 Hong Kong
-
 Hungary
-
 India
-
 Indonesia
-
 Iran, Islamic republic
-
 Iraq
-
 Ireland
-
 Israel
-
 Italy
-
 Jamaica
-
 Japan
-
 Jordan
-
 Kazakhstan
-
 Kenya
-
 Korea
-
 Kuwait
-
 Kyrgyzstan
-
 Laos
-
 Latvia
-
 Lebanon
-
 Lesotho
-
 Libya
-
 Lithuania
-
 Luxembourg
-
 Madagascar
-
 Malaysia
-
 Malta
-
 Mauritius
-
 Mexico
-
 Moldova
-
 Mongolia
-
 Montenegro
-
 Morocco
-
 Mozambique
-
 Myanmar
-
 Namibia
-
 Nepal
-
 Netherlands
-
 New Zealand
-
 Nigeria
-
 North Macedonia
-
 Norway
-
 Oman
-
 Pakistan
-
 Palestine
-
 Panama
-
 Papua New Guinea
-
 Paraguay
-
 Peru
-
 Philippines
-
 Poland
-
 Portugal
-
 Puerto Rico
-
 Qatar
-
 Reunion
-
 Romania
-
 Rwanda
-
 Saudi Arabia
-
 Serbia
-
 Singapore
-
 Slovakia
-
 Slovenia
-
 Somalia
-
 South Africa
-
 Spain
-
 Sri Lanka
-
 Sweden
-
 Switzerland
-
 Syria
-
 Taiwan
-
 Tajikistan
-
 Tanzania
-
 Thailand
-
 Trinidad and Tobago
-
 Tunisia
-
 Turkey
-
 UAE
-
 Uganda
-
 Ukraine
-
 United Kingdom
-
United States
-
 Uruguay
-
 Uzbekistan
-
 Venezuela
-
 Vietnam
-
 Yemen
-
 Zambia
-
 Zimbabwe
- Forex
- Crypto












