

Kimberly-Clark stock forecast: Support pressure in focus

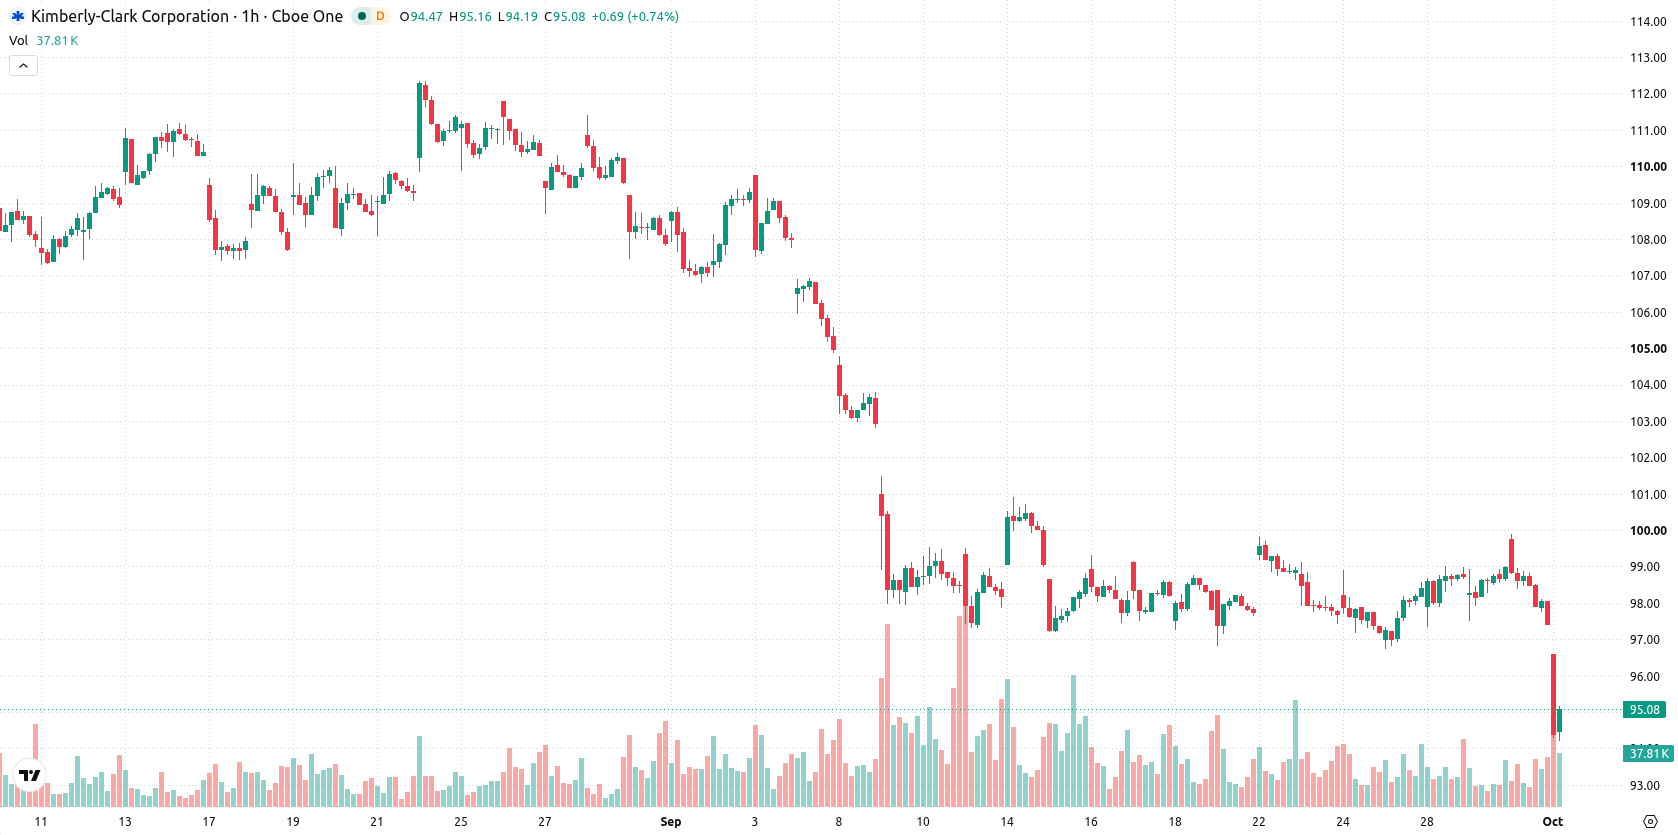
Kimberly-Clark (KMB) stock is trading at $94.86, marking a decline of 2.64% from the previous session. The price remains below its key moving averages.
 111.16
112.62
Highlights
- Kimberly-Clark confirmed executive shifts and transitional arrangements as it prepares to complete the acquisition of Kenvue Inc.
- New exchange offers and consent solicitations for Kenvue's notes could alter Kimberly-Clark's debt and liquidity structure ahead of closing.
- Shares of Kimberly-Clark closed at $94.86 after falling 2.64%, with technical signals showing sustained downside momentum and a projected range of $90.39 to $96.18.
Leadership transition and debt moves raise operational and liquidity risks
Kimberly-Clark has announced a series of executive transitions and leadership updates as it gears up to finalize its acquisition of Kenvue Inc., according to Prnewswire. These internal changes, including the planned departure of President and COO Russ Torres while retaining him through late 2026 for transitional support, may contribute to short-term operational uncertainty during the integration period, as reported by Gurufocus. Additionally, the company has launched exchange offers and consent solicitations for Kenvue's outstanding notes, a move that could impact its debt structure and liquidity profile ahead of the transaction, according to Finance Yahoo. These developments unfold as the market continues to assess the operational and financial implications of the pending acquisition, though price action has remained under broader selling pressure.
Bearish momentum persists amid oversold signals and resistance levels
On the technical side, KMB/USD trades below the MA-20 and MA-50 on the H1 chart, with the MA-200 on the daily timeframe acting as further overhead resistance. The Ichimoku Kijun sits at $98.42, establishing a key resistance zone, while immediate support levels are defined intraday near the session low. The RSI at 36.32 signals a bearish momentum, with both Stoch RSI and CCI confirming oversold conditions that may suggest selling exhaustion. MACD and ADX remain neutral, as does the Awesome Oscillator, but Bull/Bear Power maintains a negative bias towards selling dominance.
Downside bias dominates as reversal chances remain limited
Over the next 2 to 3 trading days, KMB is likely to range between $90.39 and $96.18, consistent with its recent volatility band. Downside continuation dominates the short-term outlook, supported by a 78% probability of further losses and just a 22% chance of reversal. Sideways movement is projected as the baseline scenario unless the price can recover above $98.42, while a drop below $90.39 would open the door for deeper declines.
Previously it was reported that longer-term gains from the anticipated Kenvue acquisition remained central to Kimberly-Clark's investment case, despite ongoing operational and market pressures. The latest developments—including executive transitions and debt-related maneuvers—add a new layer of integration risk, making a sustained recovery above the $98.42 resistance a critical threshold to determine any shift away from the current downside bias.






Latest Kimberly-Clark News





-
 Afghanistan
-
 Albania
-
 Algeria
-
 Angola
-
 Argentina
-
 Armenia
-
 Australia
-
 Austria
-
 Azerbaijan
-
 Bahamas
-
 Bahrain
-
 Bangladesh
-
 Belarus
-
 Belgium
-
 Bolivia
-
 Botswana
-
 Brazil
-
 Brunei
-
 Bulgaria
-
 Cambodia
-
 Cameroon
-
 Canada
-
 Chile
-
 China
-
 Colombia
-
 Congo
-
 Costa Rica
-
 Cote d'Ivoire
-
 Croatia
-
 Cuba
-
 Cyprus
-
 Czechia
-
 DR Congo
-
 Denmark
-
 Dominican Republic
-
 Ecuador
-
 Egypt
-
 El Salvador
-
 Estonia
-
 Eswatini
-
 Ethiopia
-
 Finland
-
 France
-
 Georgia
-
 Germany
-
 Ghana
-
 Greece
-
 Haiti
-
 Hong Kong
-
 Hungary
-
 India
-
 Indonesia
-
 Iran, Islamic republic
-
 Iraq
-
 Ireland
-
 Israel
-
 Italy
-
 Jamaica
-
 Japan
-
 Jordan
-
 Kazakhstan
-
 Kenya
-
 Korea
-
 Kuwait
-
 Kyrgyzstan
-
 Laos
-
 Latvia
-
 Lebanon
-
 Lesotho
-
 Libya
-
 Lithuania
-
 Luxembourg
-
 Madagascar
-
 Malaysia
-
 Malta
-
 Mauritius
-
 Mexico
-
 Moldova
-
 Mongolia
-
 Montenegro
-
 Morocco
-
 Mozambique
-
 Myanmar
-
 Namibia
-
 Nepal
-
 Netherlands
-
 New Zealand
-
 Nigeria
-
 North Macedonia
-
 Norway
-
 Oman
-
 Pakistan
-
 Palestine
-
 Panama
-
 Papua New Guinea
-
 Paraguay
-
 Peru
-
 Philippines
-
 Poland
-
 Portugal
-
 Puerto Rico
-
 Qatar
-
 Reunion
-
 Romania
-
 Rwanda
-
 Saudi Arabia
-
 Serbia
-
 Singapore
-
 Slovakia
-
 Slovenia
-
 Somalia
-
 South Africa
-
 Spain
-
 Sri Lanka
-
 Sweden
-
 Switzerland
-
 Syria
-
 Taiwan
-
 Tajikistan
-
 Tanzania
-
 Thailand
-
 Trinidad and Tobago
-
 Tunisia
-
 Turkey
-
 UAE
-
 Uganda
-
 Ukraine
-
 United Kingdom
-
United States
-
 Uruguay
-
 Uzbekistan
-
 Venezuela
-
 Vietnam
-
 Yemen
-
 Zambia
-
 Zimbabwe
- Forex
- Crypto












