

Robinhood shares technical analysis: Resistance test at $117.07 in focus

Robinhood (HOOD) stock is trading at $116.73, advancing 5.11% on the day and closing near its session high. The price sits above its key short-term averages, but remains capped by intermediate resistance, while staying well supported over the longer term.
 85.21
96.65
Highlights
- Robinhood Markets introduced expanded 24/7 trading, AI-driven tools, prediction markets, and private-market investing capabilities to its platform.
- The company aims to increase platform engagement and attract both retail and sophisticated clients ahead of third quarter 2026 earnings.
- Robinhood stock trades above key long-term support with intraday gains despite bearish momentum signals, with an expected range of $109.09 to $121.93.
Expanded trading and AI features drive platform engagement potential
Robinhood Markets has unveiled a suite of platform enhancements at the 2026 HOOD Summit in Houston, including expanded 24/7 trading, AI-powered tools, prediction markets, and features for private-market investing, according to Investing.com. This comprehensive rollout broadens Robinhood's product offering and is likely to increase platform engagement, attracting both retail and more sophisticated clients while positioning the firm to capture additional trading volumes. The upcoming release of third quarter 2026 financial results, as noted by Marketscreener, also puts near-term focus on earnings and overall performance as catalysts for continued market activity.
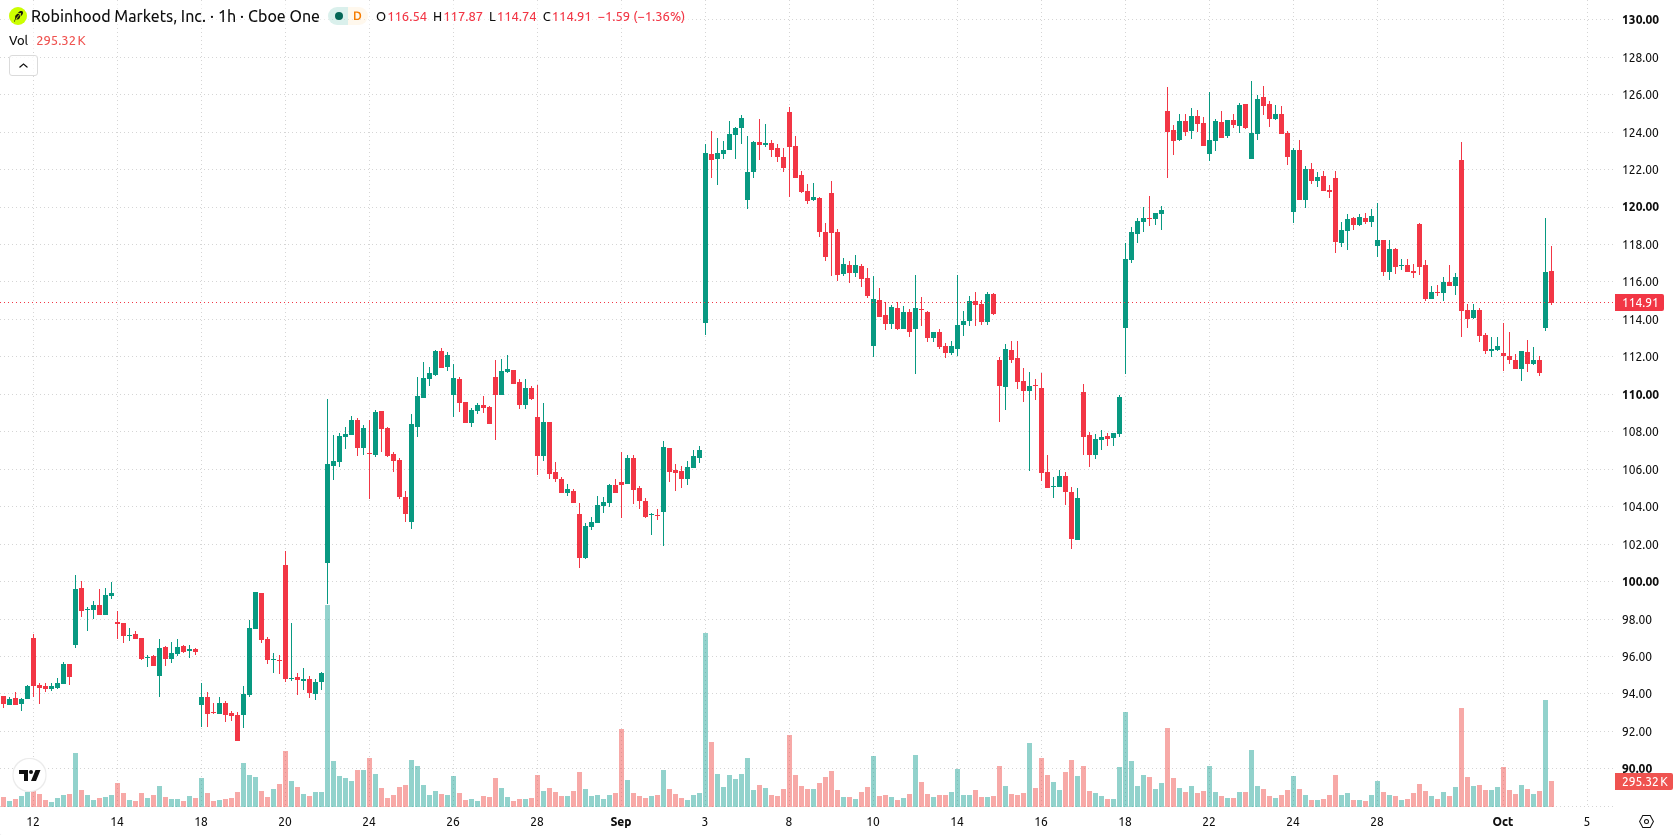
Divergent price strength as technical resistance meets bearish momentum
On the technical front, HOOD is trading above its MA-20 while remaining below the MA-50 on the hourly chart, and stands well above its long-term MA-200, confirming persistent support at higher timeframes. The Ichimoku Kijun level at $117.07 represents immediate resistance. Momentum signals remain negative as the MACD posts a strong sell reading, the ADX is neutral, and both the RSI (27.32) and Stochastic RSI reflect oversold conditions. The CCI is on a sell signal, and Bull/Bear Power shows sellers dominating intraday momentum, highlighting the divergence between recent strong price action and bearish momentum indicators.
Bullish bias prevails with volatility and key level risks
In the coming sessions, HOOD is projected to trade within a range of $109.09 to $121.93, reflecting typical volatility around current levels. There is a 70% probability of an upward move indicated by short-term projections, suggesting that further downside is less likely but cannot be ruled out entirely. A consolidation phase is expected unless price breaks key levels, with a bullish scenario predicated on crossing above the $117.07 resistance and a bearish outcome unfolding if support near $109 fails.
Previously it was reported that Robinhood faced potential constraints on expanding tokenized equity offerings in the U.S. market due to regulatory volume limits. The introduction of new trading technology and diversified platform features now broadens the firm's operational scope, making the $117.07 resistance level a crucial threshold for the next decisive move.






Latest Robinhood News





-
 Afghanistan
-
 Albania
-
 Algeria
-
 Angola
-
 Argentina
-
 Armenia
-
 Australia
-
 Austria
-
 Azerbaijan
-
 Bahamas
-
 Bahrain
-
 Bangladesh
-
 Belarus
-
 Belgium
-
 Bolivia
-
 Botswana
-
 Brazil
-
 Brunei
-
 Bulgaria
-
 Cambodia
-
 Cameroon
-
 Canada
-
 Chile
-
 China
-
 Colombia
-
 Congo
-
 Costa Rica
-
 Cote d'Ivoire
-
 Croatia
-
 Cuba
-
 Cyprus
-
 Czechia
-
 DR Congo
-
 Denmark
-
 Dominican Republic
-
 Ecuador
-
 Egypt
-
 El Salvador
-
 Estonia
-
 Eswatini
-
 Ethiopia
-
 Finland
-
 France
-
 Georgia
-
 Germany
-
 Ghana
-
 Greece
-
 Haiti
-
 Hong Kong
-
 Hungary
-
 India
-
 Indonesia
-
 Iran, Islamic republic
-
 Iraq
-
 Ireland
-
 Israel
-
 Italy
-
 Jamaica
-
 Japan
-
 Jordan
-
 Kazakhstan
-
 Kenya
-
 Korea
-
 Kuwait
-
 Kyrgyzstan
-
 Laos
-
 Latvia
-
 Lebanon
-
 Lesotho
-
 Libya
-
 Lithuania
-
 Luxembourg
-
 Madagascar
-
 Malaysia
-
 Malta
-
 Mauritius
-
 Mexico
-
 Moldova
-
 Mongolia
-
 Montenegro
-
 Morocco
-
 Mozambique
-
 Myanmar
-
 Namibia
-
 Nepal
-
 Netherlands
-
 New Zealand
-
 Nigeria
-
 North Macedonia
-
 Norway
-
 Oman
-
 Pakistan
-
 Palestine
-
 Panama
-
 Papua New Guinea
-
 Paraguay
-
 Peru
-
 Philippines
-
 Poland
-
 Portugal
-
 Puerto Rico
-
 Qatar
-
 Reunion
-
 Romania
-
 Rwanda
-
 Saudi Arabia
-
 Serbia
-
 Singapore
-
 Slovakia
-
 Slovenia
-
 Somalia
-
 South Africa
-
 Spain
-
 Sri Lanka
-
 Sweden
-
 Switzerland
-
 Syria
-
 Taiwan
-
 Tajikistan
-
 Tanzania
-
 Thailand
-
 Trinidad and Tobago
-
 Tunisia
-
 Turkey
-
 UAE
-
 Uganda
-
 Ukraine
-
 United Kingdom
-
United States
-
 Uruguay
-
 Uzbekistan
-
 Venezuela
-
 Vietnam
-
 Yemen
-
 Zambia
-
 Zimbabwe
- Forex
- Crypto












