

TSM rallies as quarterly ADR dividend of $1.11 per share confirmed

Shares of Taiwan Semiconductor Manufacturing Company Limited (TSM) stock are trading at $473.5, up 3.11% for the day. The price is positioned above its key moving averages and remains near the high of today's range on moderate volatility.
 440.88
Highlights
- TSMC declared a $1.11 per share ADR dividend for October 8, 2026, establishing a clear forward yield anchor.
- TSMC is considering a major investment to build a Texas campus that would add tens of billions to its U.S. manufacturing commitments.
- TSMC stock trades near $473.5 with strong bullish momentum and is expected to range between $465.22 and $481.78 in the coming days.
Dividend hike and Texas expansion reinforce investor demand and sector leadership
TSMC has declared its next quarterly ADR dividend of $1.11 per share, scheduled for payment on October 8, 2026, providing a firm forward yield anchor that can drive investor demand for the stock. In parallel, the company is evaluating a significant potential investment to construct a new campus in Texas as part of its U.S. chip manufacturing expansion, which would add tens of billions of dollars in new commitments to its ongoing $265 billion investment in Arizona, according to Finance Yahoo. These corporate actions demonstrate TSMC's dual focus on direct value returns and the expansion of its strategic footprint in advanced semiconductor manufacturing, reinforcing strong market interest in light of rising sector demand.
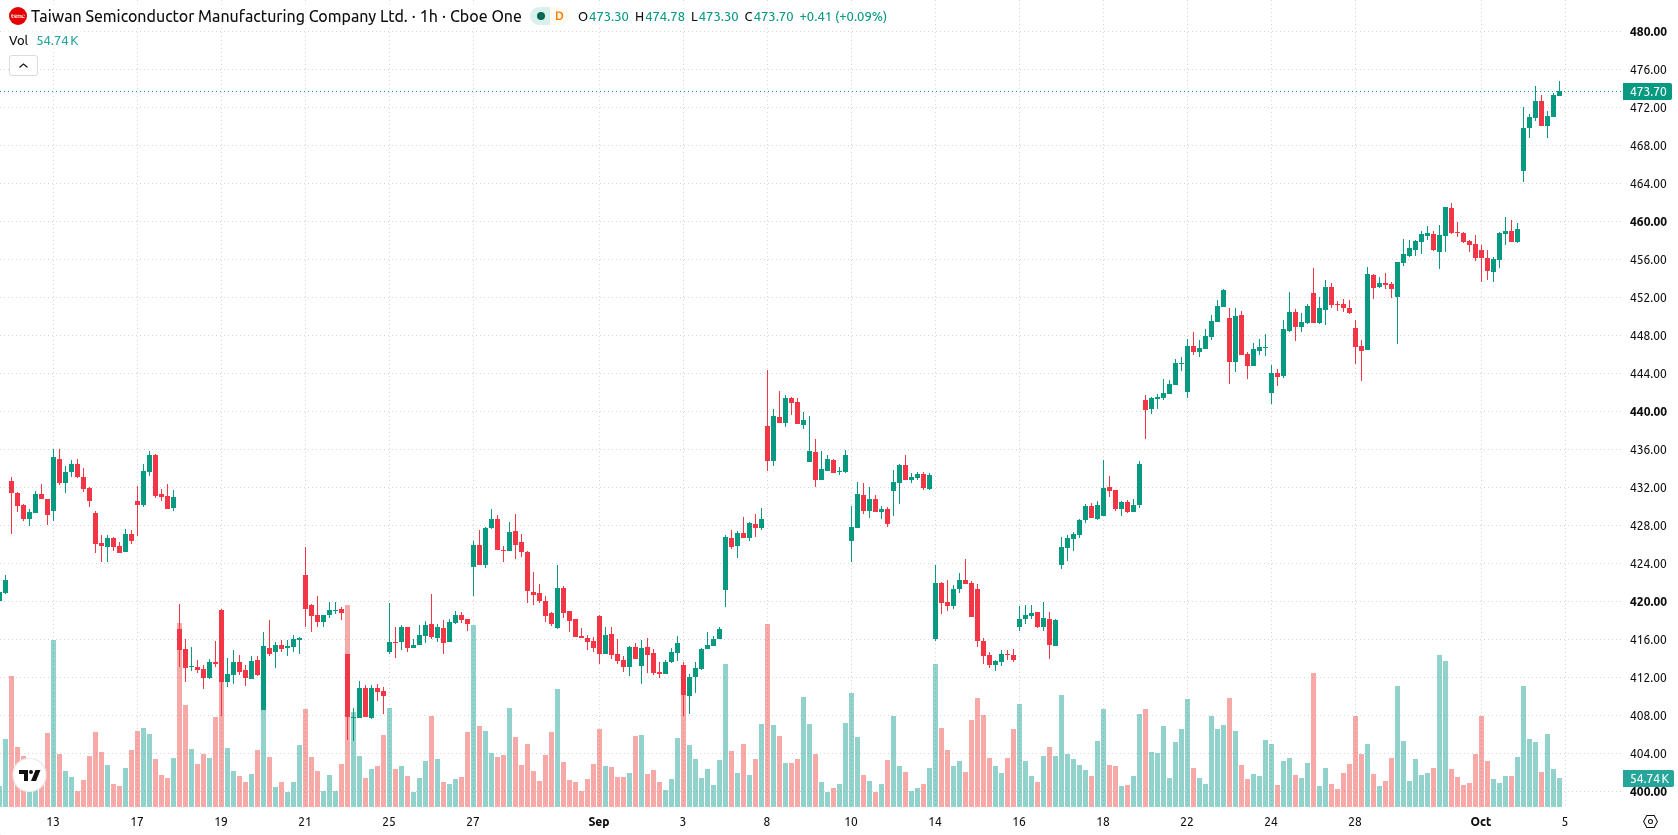
Bullish momentum signals form as support holds above crowded moving averages
TSM is trading above the MA-20 at $458.55, the MA-50 at $453.51, and the MA-200 at $386.21. The Ichimoku Kijun line at $459.29 serves as immediate support. Major momentum signals show a bullish bias: MACD is on a buy signal, while ADX points to moderate trend strength. RSI, Stoch RSI, CCI, and Bull/Bear Power all indicate overbought or strong buyer dominance; the Awesome Oscillator (AO) confirms prevailing bullish momentum. Short-term oscillators indicate overbought conditions and hint at possible divergence if bullish momentum weakens.
Range-bound outlook persists as bullish breakout risk increases
In the short term, TSM is expected to consolidate within a range of $465.22 to $481.78, reflecting a typical volatility band relative to current levels. The most likely scenario is continued sideways movement between these bounds, with a higher probability for the upper range to be tested if bullish momentum continues. An upside breakout above $481.78 would support further gains, while a decline below immediate support at $459.29 would challenge the bullish outlook but is currently seen as unlikely.
Earlier, analysts noted that TSMC's strategic investments and expanding role in advanced semiconductor manufacturing were central to its long-term growth outlook. The current technical positioning and planned U.S. capacity expansion further strengthen this foundation, making the $481.78 resistance level a pivotal area to watch for a confirmed upside breakout.






Latest TSMC News





-
 Afghanistan
-
 Albania
-
 Algeria
-
 Angola
-
 Argentina
-
 Armenia
-
 Australia
-
 Austria
-
 Azerbaijan
-
 Bahamas
-
 Bahrain
-
 Bangladesh
-
 Belarus
-
 Belgium
-
 Bolivia
-
 Botswana
-
 Brazil
-
 Brunei
-
 Bulgaria
-
 Cambodia
-
 Cameroon
-
 Canada
-
 Chile
-
 China
-
 Colombia
-
 Congo
-
 Costa Rica
-
 Cote d'Ivoire
-
 Croatia
-
 Cuba
-
 Cyprus
-
 Czechia
-
 DR Congo
-
 Denmark
-
 Dominican Republic
-
 Ecuador
-
 Egypt
-
 El Salvador
-
 Estonia
-
 Eswatini
-
 Ethiopia
-
 Finland
-
 France
-
 Georgia
-
 Germany
-
 Ghana
-
 Greece
-
 Haiti
-
 Hong Kong
-
 Hungary
-
 India
-
 Indonesia
-
 Iran, Islamic republic
-
 Iraq
-
 Ireland
-
 Israel
-
 Italy
-
 Jamaica
-
 Japan
-
 Jordan
-
 Kazakhstan
-
 Kenya
-
 Korea
-
 Kuwait
-
 Kyrgyzstan
-
 Laos
-
 Latvia
-
 Lebanon
-
 Lesotho
-
 Libya
-
 Lithuania
-
 Luxembourg
-
 Madagascar
-
 Malaysia
-
 Malta
-
 Mauritius
-
 Mexico
-
 Moldova
-
 Mongolia
-
 Montenegro
-
 Morocco
-
 Mozambique
-
 Myanmar
-
 Namibia
-
 Nepal
-
 Netherlands
-
 New Zealand
-
 Nigeria
-
 North Macedonia
-
 Norway
-
 Oman
-
 Pakistan
-
 Palestine
-
 Panama
-
 Papua New Guinea
-
 Paraguay
-
 Peru
-
 Philippines
-
 Poland
-
 Portugal
-
 Puerto Rico
-
 Qatar
-
 Reunion
-
 Romania
-
 Rwanda
-
 Saudi Arabia
-
 Serbia
-
 Singapore
-
 Slovakia
-
 Slovenia
-
 Somalia
-
 South Africa
-
 Spain
-
 Sri Lanka
-
 Sweden
-
 Switzerland
-
 Syria
-
 Taiwan
-
 Tajikistan
-
 Tanzania
-
 Thailand
-
 Trinidad and Tobago
-
 Tunisia
-
 Turkey
-
 UAE
-
 Uganda
-
 Ukraine
-
 United Kingdom
-
United States
-
 Uruguay
-
 Uzbekistan
-
 Venezuela
-
 Vietnam
-
 Yemen
-
 Zambia
-
 Zimbabwe
- Forex
- Crypto












