

Tilray stock price prediction: Resistance test ahead

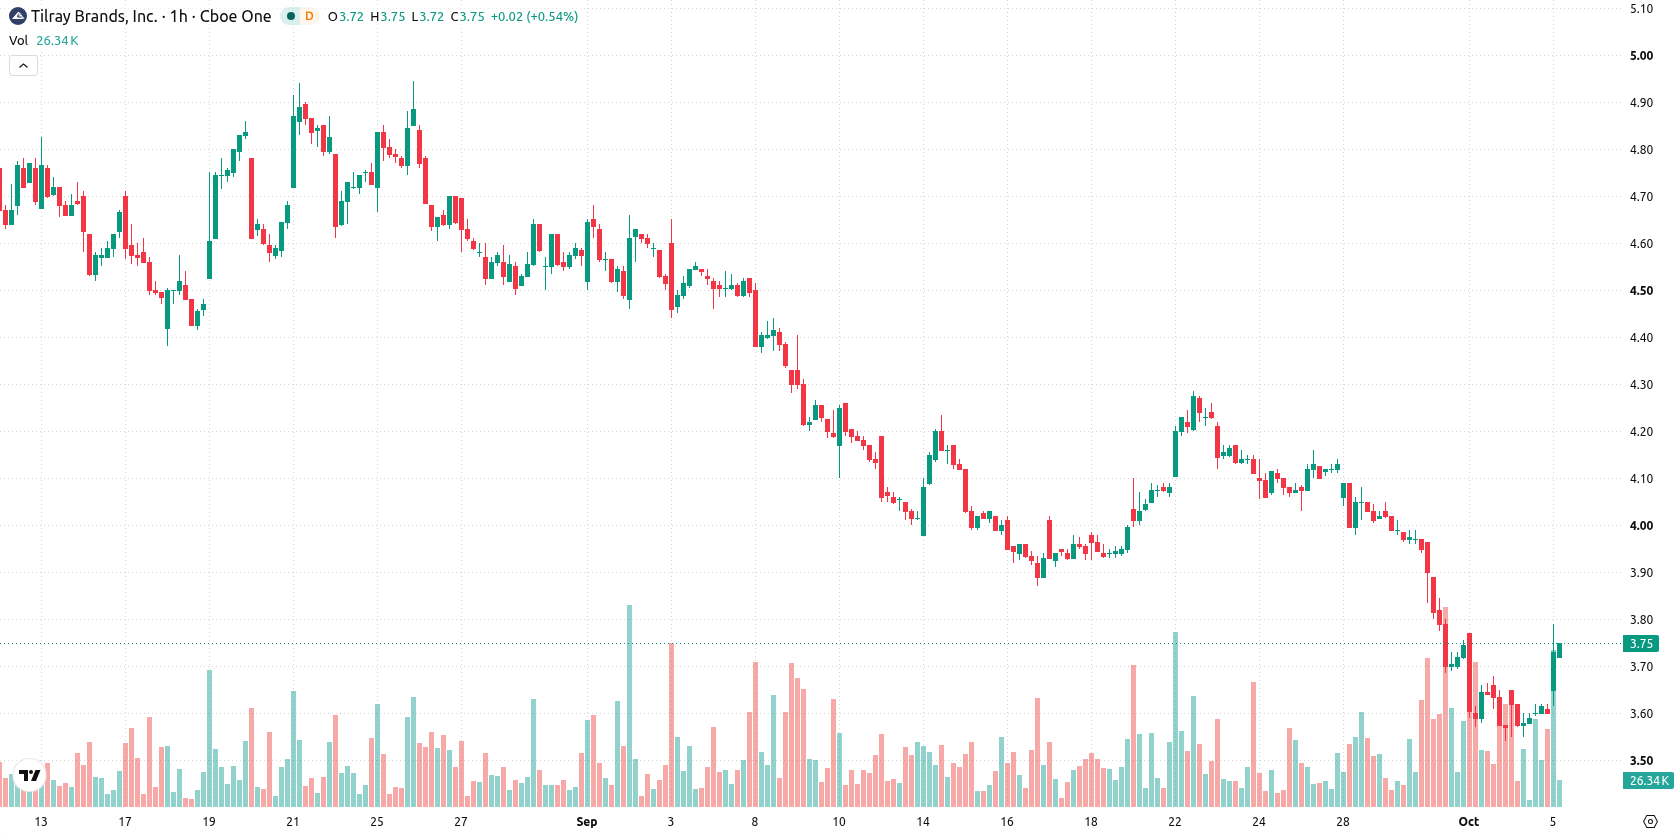
Tilray (TLRY) stock is trading at $3.73 after rising 3.46% intraday. The price sits above its key short-term moving average while remaining below both medium- and long-term trend measures.
 2.65
2.80
Highlights
- New technical trading signals for Tilray Brands stock were published September 1, 2026, providing updated buy and sell guidance.
- Release of these signals can affect short-term positioning and shift trading activity as investors react to new recommendations.
- Shares trade above short-term averages but below key medium and long-term levels, with expected range at $3.5 to $3.96 and 70% probability of further downside.
Market sentiment adjusts as new trading signals influence positioning
New technical analysis and trading signals for Tilray Brands Inc. were published on September 1, 2026, according to Canada Stocktradersdaily. The release provides investors with updated guidance on buy and sell opportunities, directly shaping short-term market positioning. As the market processes these signals, trading sentiment and activity can shift in response to the latest recommendations.
Bearish momentum persists amid mixed technical indicators
MA-20 is positioned at $3.65, with the price holding above this level while still trading under MA-50 at $3.89 and MA-200 at $6.17. The Ichimoku Kijun, at $3.78, marks immediate resistance. On the hourly chart, both MACD and ADX highlight continued bearish momentum. RSI registers a low reading of 34.47 (Sell), Stochastic RSI indicates overbought conditions, CCI is Neutral, and Bull/Bear Power points to seller dominance intraday. The Awesome Oscillator is Neutral, reflecting the absence of a strong confirmed trend.
Downside risk exceeds upside as breakout hinges on key levels
Over the coming trading days, the expected price range for TLRY spans $3.5 to $3.96, consistent with typical volatility relative to current levels. There is a 30% probability of a move higher, while the downside scenario is more likely at 70%. If price action remains confined within this corridor, sideways consolidation would be the base case, with a bullish breakout requiring clearance of resistance at $3.78 and a break below $3.5 confirming a further bearish extension.
Previously it was reported that Tilray remained under persistent selling pressure, with technical indicators broadly supporting a bearish outlook. The current analysis adds nuance to this view by identifying continued downside risk within a defined trading corridor, with $3.78 serving as a key level for short-term direction.






Latest Tilray Brands News




-
 Afghanistan
-
 Albania
-
 Algeria
-
 Angola
-
 Argentina
-
 Armenia
-
 Australia
-
 Austria
-
 Azerbaijan
-
 Bahamas
-
 Bahrain
-
 Bangladesh
-
 Belarus
-
 Belgium
-
 Bolivia
-
 Botswana
-
 Brazil
-
 Brunei
-
 Bulgaria
-
 Cambodia
-
 Cameroon
-
 Canada
-
 Chile
-
 China
-
 Colombia
-
 Congo
-
 Costa Rica
-
 Cote d'Ivoire
-
 Croatia
-
 Cuba
-
 Cyprus
-
 Czechia
-
 DR Congo
-
 Denmark
-
 Dominican Republic
-
 Ecuador
-
 Egypt
-
 El Salvador
-
 Estonia
-
 Eswatini
-
 Ethiopia
-
 Finland
-
 France
-
 Georgia
-
 Germany
-
 Ghana
-
 Greece
-
 Haiti
-
 Hong Kong
-
 Hungary
-
 India
-
 Indonesia
-
 Iran, Islamic republic
-
 Iraq
-
 Ireland
-
 Israel
-
 Italy
-
 Jamaica
-
 Japan
-
 Jordan
-
 Kazakhstan
-
 Kenya
-
 Korea
-
 Kuwait
-
 Kyrgyzstan
-
 Laos
-
 Latvia
-
 Lebanon
-
 Lesotho
-
 Libya
-
 Lithuania
-
 Luxembourg
-
 Madagascar
-
 Malaysia
-
 Malta
-
 Mauritius
-
 Mexico
-
 Moldova
-
 Mongolia
-
 Montenegro
-
 Morocco
-
 Mozambique
-
 Myanmar
-
 Namibia
-
 Nepal
-
 Netherlands
-
 New Zealand
-
 Nigeria
-
 North Macedonia
-
 Norway
-
 Oman
-
 Pakistan
-
 Palestine
-
 Panama
-
 Papua New Guinea
-
 Paraguay
-
 Peru
-
 Philippines
-
 Poland
-
 Portugal
-
 Puerto Rico
-
 Qatar
-
 Reunion
-
 Romania
-
 Rwanda
-
 Saudi Arabia
-
 Serbia
-
 Singapore
-
 Slovakia
-
 Slovenia
-
 Somalia
-
 South Africa
-
 Spain
-
 Sri Lanka
-
 Sweden
-
 Switzerland
-
 Syria
-
 Taiwan
-
 Tajikistan
-
 Tanzania
-
 Thailand
-
 Trinidad and Tobago
-
 Tunisia
-
 Turkey
-
 UAE
-
 Uganda
-
 Ukraine
-
 United Kingdom
-
United States
-
 Uruguay
-
 Uzbekistan
-
 Venezuela
-
 Vietnam
-
 Yemen
-
 Zambia
-
 Zimbabwe
- Forex
- Crypto












