

Strategy stock support test: Key levels to watch

Strategy (MSTR, formerly MicroStrategy) stock is trading at $147.59 after falling 3.77% today. The price currently sits below its key short- and medium-term moving averages, while remaining above long-term levels.
 137.30
144.69
Highlights
- Strategy spent $142.5 million from USD reserves in one week to cover preferred stock dividends and debt interest payments.
- The company increased its Bitcoin holdings by 334 BTC for $28.7 million, now controlling 848,000 coins and increasing digital asset market exposure.
- Shares of Strategy trade below key short- and medium-term moving averages, with technical indicators broadly negative and an expected range of $139.91 to $155.27.
Balance-sheet pressures intensify as digital asset bets expand
According to Tradingkey, Strategy spent approximately $142.5 million from its USD reserve in a single week to meet preferred stock dividend obligations and interest payments on outstanding debt, underscoring a period of balance-sheet strain as digital asset prices pulled back. Simplywall reported that the company also reaffirmed a 12% annual dividend rate on its Variable Rate Series A Perpetual Preferred Stock (STRC), with new semi-monthly cash dividends scheduled through October and November 2026, pointing to ongoing capital commitments during heightened market volatility. In addition, News Futunn noted that Strategy acquired 334 BTC for $28.7 million between October 1 and 4, 2026, increasing its total digital asset holdings to 848,000 coins and further elevating its exposure to price swings in the cryptocurrency market.
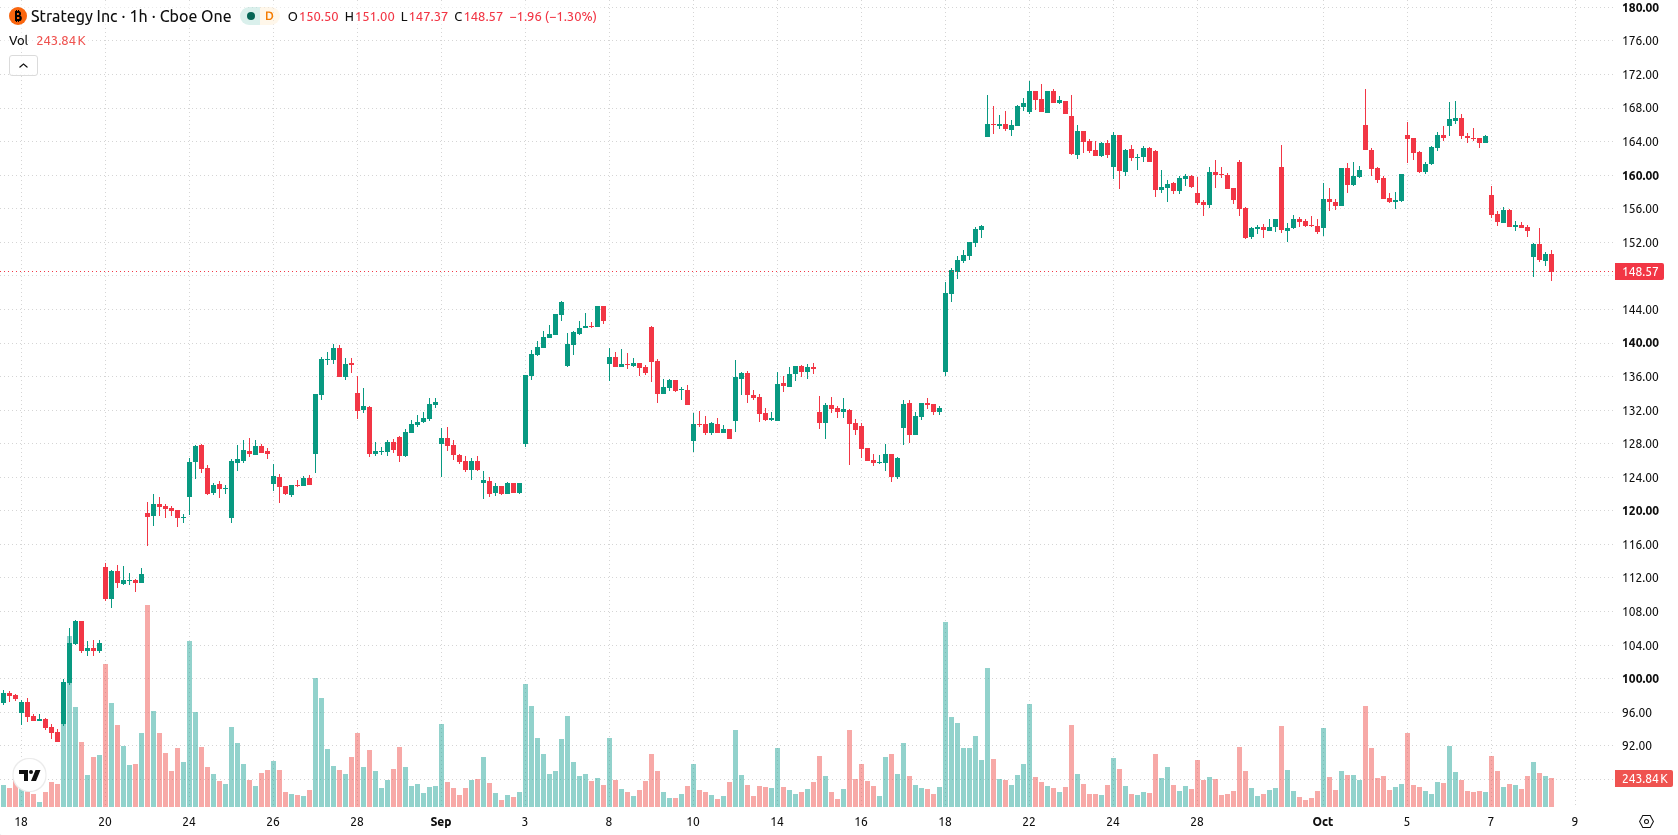
Bearish momentum persists as resistance limits recovery attempts
The price is currently trading below the MA-20 at $160.62 and MA-50 at $158.29, but remains above the MA-200 at $135.97. The Ichimoku Kijun level at $160.67 acts as immediate resistance, containing potential upward moves. Momentum indicators, including MACD and ADX, continue to signal ongoing selling pressure. RSI sits at 35.57, with Stochastic RSI, CCI, and Bull/Bear Power all pointing to oversold readings and sustained seller dominance intraday. The Awesome Oscillator also signals to the downside, in alignment with prevailing bearish momentum.
Downside risk prevails as reversal probabilities diminish
Over the next few trading days, price is expected to consolidate within the $139.91 to $155.27 range. With a 29% probability of an upward move and 71% chance of a further decline, an upward reversal is statistically unlikely. If the price breaks decisively above resistance, a retest of higher levels could develop, while a drop below support may accelerate downside momentum toward the lower end of the forecast range.
Earlier, analysts noted that Strategy's substantial digital asset gains and aggressive buybacks were accompanied by tightening liquidity and the potential for increased volatility as shareholder decisions loomed. The latest developments underscore persistent balance-sheet strain and amplified downside risk, making a decisive move below the current support band the key scenario to monitor in the near term.






Latest Strategy News




-
 Afghanistan
-
 Albania
-
 Algeria
-
 Angola
-
 Argentina
-
 Armenia
-
 Australia
-
 Austria
-
 Azerbaijan
-
 Bahamas
-
 Bahrain
-
 Bangladesh
-
 Belarus
-
 Belgium
-
 Bolivia
-
 Botswana
-
 Brazil
-
 Brunei
-
 Bulgaria
-
 Cambodia
-
 Cameroon
-
 Canada
-
 Chile
-
 China
-
 Colombia
-
 Congo
-
 Costa Rica
-
 Cote d'Ivoire
-
 Croatia
-
 Cuba
-
 Cyprus
-
 Czechia
-
 DR Congo
-
 Denmark
-
 Dominican Republic
-
 Ecuador
-
 Egypt
-
 El Salvador
-
 Estonia
-
 Eswatini
-
 Ethiopia
-
 Finland
-
 France
-
 Georgia
-
 Germany
-
 Ghana
-
 Greece
-
 Haiti
-
 Hong Kong
-
 Hungary
-
 India
-
 Indonesia
-
 Iran, Islamic republic
-
 Iraq
-
 Ireland
-
 Israel
-
 Italy
-
 Jamaica
-
 Japan
-
 Jordan
-
 Kazakhstan
-
 Kenya
-
 Korea
-
 Kuwait
-
 Kyrgyzstan
-
 Laos
-
 Latvia
-
 Lebanon
-
 Lesotho
-
 Libya
-
 Lithuania
-
 Luxembourg
-
 Madagascar
-
 Malaysia
-
 Malta
-
 Mauritius
-
 Mexico
-
 Moldova
-
 Mongolia
-
 Montenegro
-
 Morocco
-
 Mozambique
-
 Myanmar
-
 Namibia
-
 Nepal
-
 Netherlands
-
 New Zealand
-
 Nigeria
-
 North Macedonia
-
 Norway
-
 Oman
-
 Pakistan
-
 Palestine
-
 Panama
-
 Papua New Guinea
-
 Paraguay
-
 Peru
-
 Philippines
-
 Poland
-
 Portugal
-
 Puerto Rico
-
 Qatar
-
 Reunion
-
 Romania
-
 Rwanda
-
 Saudi Arabia
-
 Serbia
-
 Singapore
-
 Slovakia
-
 Slovenia
-
 Somalia
-
 South Africa
-
 Spain
-
 Sri Lanka
-
 Sweden
-
 Switzerland
-
 Syria
-
 Taiwan
-
 Tajikistan
-
 Tanzania
-
 Thailand
-
 Trinidad and Tobago
-
 Tunisia
-
 Turkey
-
 UAE
-
 Uganda
-
 Ukraine
-
 United Kingdom
-
United States
-
 Uruguay
-
 Uzbekistan
-
 Venezuela
-
 Vietnam
-
 Yemen
-
 Zambia
-
 Zimbabwe
- Forex
- Crypto












