

Home Depot stock weekly forecast: Upside capped near $292 with resistance levels in focus

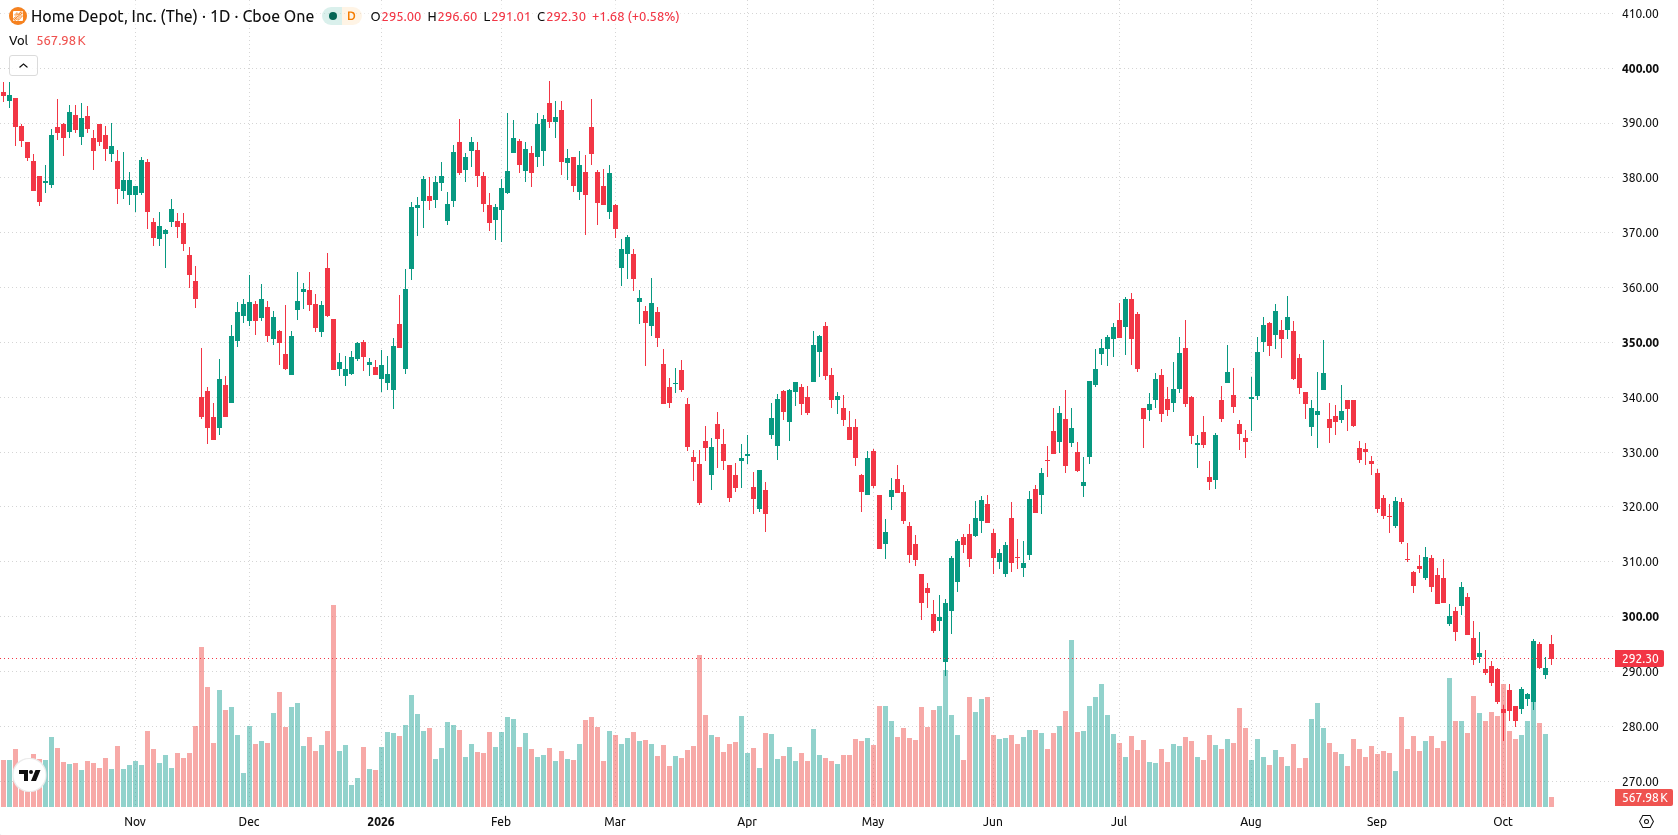
Shares of Home Depot, Inc (HD) are trading near $292 as rebound odds remain subdued this week. Despite ongoing strategic investment and M&A activity, the technical setup continues to limit upside potential in the sessions ahead.
 296.60
296.60
296.60
Highlights
- Shares of Home Depot trade at $292.43, showing a slight gain over the past 7 days but remaining below key longer-term averages.
- The chart pattern is bearish, with price action capped by resistance and mixed momentum signals indicating overbought conditions without a confirmed upside move.
- Forecast range for the week is $281.53 to $298.14, with a 76% probability of decline and nearest support at $282.9.
Institutional flows shift as M&A-driven spending outpaces share performance
Home Depot has invested heavily in AI-driven tools, digital platforms, and Pro services, helping lift digital sales by 15.7% in the second quarter of fiscal 2026, according to Yahoo Finance (source: Yahoo Finance). The company allocated $542 million to capital expenditures in support of its Total Home strategy, while reaffirming its full-year business outlook (sources: Yahoo Finance, TradingKey). Despite these moves, HD's shares have lagged over the past year and institutional investors have responded to value opportunities created by recent acquisition-driven adjustments, according to Yahoo Finance and TradingKey.
Overbought conditions persist as MACD and Kijun reinforce resistance zones
On the daily chart, price action is capped by the 20-day moving average at $292.72 and faces further resistance at the Ichimoku Kijun near $299.55. Despite an emerging move higher that is not yet confirmed, momentum signals remain mixed: while Stochastic RSI is in an overbought zone at 80.26, MACD continues to forecast a strong sell and the Bull/Bear Power reading indicates overbought conditions. Volatility over the past week has measured 4.52%, with nearest support down at $282.9.
Bearish bias dominates as price faces resistance on subdued breakout probability
In the week ahead, the expected range is $281.53 to $298.14, with a 24% probability of an increase and a 76% chance of a decrease. The base case is for Home Depot shares to drift inside this zone, pinned to resistance at the 20-day average. A sustained move above $292.72 could open the way to test the Kijun at $299.55, while a break below support at $282.9 would leave the stock vulnerable to further downside within the forecasted range.
Earlier, analysts noted that Home Depot was showing near-term technical strength but faced key resistance that could limit upside momentum. The current analysis adds a fresh dimension, highlighting how ongoing investments and acquisition activity are not yet translating into a stronger technical outlook, with the principal risk now being a move below $282.9 that could extend the recent downside.









-
 Afghanistan
-
 Albania
-
 Algeria
-
 Angola
-
 Argentina
-
 Armenia
-
 Australia
-
 Austria
-
 Azerbaijan
-
 Bahamas
-
 Bahrain
-
 Bangladesh
-
 Belarus
-
 Belgium
-
 Bolivia
-
 Botswana
-
 Brazil
-
 Brunei
-
 Bulgaria
-
 Cambodia
-
 Cameroon
-
 Canada
-
 Chile
Chile
-
 China
China
-
 Colombia
-
 Congo
Congo
-
 Costa Rica
-
 Cote d'Ivoire
-
 Croatia
-
 Cuba
Cuba
-
 Cyprus
-
 Czechia
-
 DR Congo
-
 Denmark
-
 Dominican Republic
-
 Ecuador
-
 Egypt
Egypt
-
 El Salvador
-
 Estonia
-
 Eswatini
-
 Ethiopia
-
 Finland
-
 France
-
 Georgia
-
 Germany
-
 Ghana
Ghana
-
 Greece
-
 Haiti
Haiti
-
 Hong Kong
-
 Hungary
-
 India
India
-
 Indonesia
-
 Iran, Islamic republic
-
 Iraq
Iraq
-
 Ireland
-
 Israel
-
 Italy
Italy
-
 Jamaica
-
 Japan
Japan
-
 Jordan
-
 Kazakhstan
-
 Kenya
Kenya
-
 Korea
Korea
-
 Kuwait
-
 Kyrgyzstan
-
 Laos
Laos
-
 Latvia
-
 Lebanon
-
 Lesotho
-
 Libya
Libya
-
 Lithuania
-
 Luxembourg
-
 Madagascar
-
 Malaysia
-
 Malta
Malta
-
 Mauritius
-
 Mexico
-
 Moldova
-
 Mongolia
-
 Montenegro
-
 Morocco
-
 Mozambique
-
 Myanmar
-
 Namibia
-
 Nepal
Nepal
-
 Netherlands
-
 New Zealand
-
 Nigeria
-
 North Macedonia
-
 Norway
-
 Oman
Oman
-
 Pakistan
-
 Palestine
-
 Panama
-
 Papua New Guinea
-
 Paraguay
-
 Peru
Peru
-
 Philippines
-
 Poland
-
 Portugal
-
 Puerto Rico
-
 Qatar
Qatar
-
 Reunion
-
 Romania
-
 Rwanda
-
 Saudi Arabia
-
 Serbia
-
 Singapore
-
 Slovakia
-
 Slovenia
-
 Somalia
-
 South Africa
-
 Spain
Spain
-
 Sri Lanka
-
 Sweden
-
 Switzerland
-
 Syria
Syria
-
 Taiwan
-
 Tajikistan
-
 Tanzania
-
 Thailand
-
 Trinidad and Tobago
-
 Tunisia
-
 Turkey
-
 UAE
UAE
-
 Uganda
-
 Ukraine
-
 United Kingdom
-
United States
-
 Uruguay
-
 Uzbekistan
-
 Venezuela
-
 Vietnam
-
 Yemen
Yemen
-
 Zambia
-
 Zimbabwe
- Forex
- Crypto












