


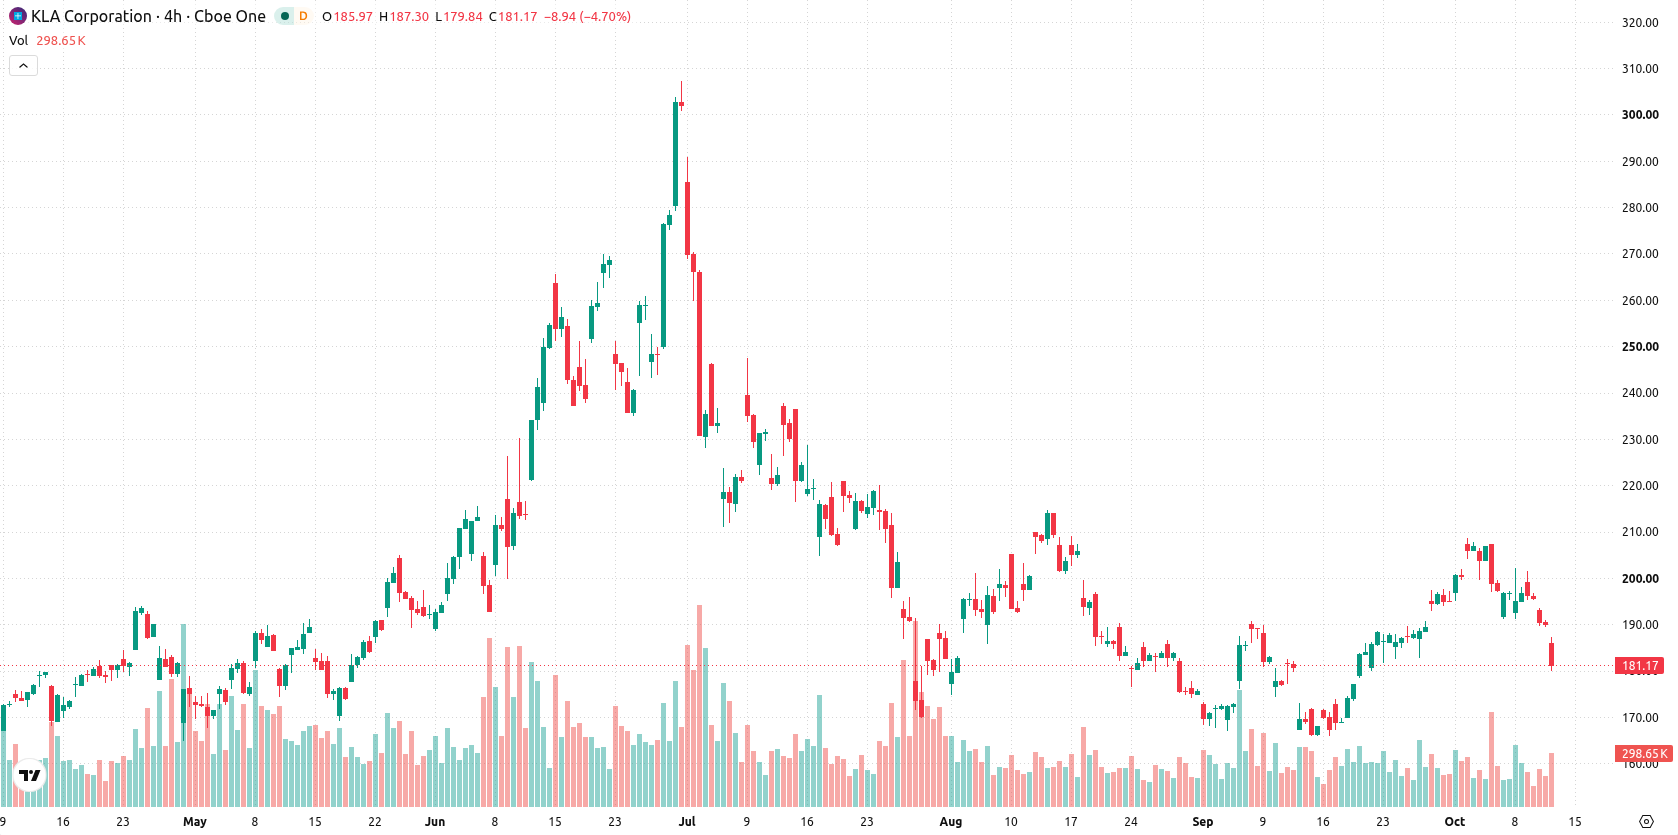
KLA Corporation (KLAC) fell 4.06% after ETF funds registered sizable outflows and recent institutional additions failed to offset broad selling pressure. The move is supported by sellers dominating trading as KLAC slipped below its 20-day and 50-day moving averages, indicating a loss of momentum and control by short-term bearish forces.
 187.30
202.12
187.30
202.12
Highlights
- KLA has been added to Baillie Gifford's US Equity Growth Strategy portfolio, maintaining its role in semiconductor process control.
- Hedge fund portfolios holding KLAC increased to 81 at the end of Q2 2026 from 71 in the prior quarter, amid over $40 million in recent ETF outflows.
- Shares of KLA trade below key short- and medium-term averages with sellers in control and an expected range of $176.06 to $188.74 over the next five days.
Hedge fund positions rise as ETF outflows deepen selling pressure
KLA reported new inclusion in Baillie Gifford's US Equity Growth Strategy portfolio, highlighting its ongoing presence in the semiconductor process control market. Regulatory filings recorded 81 hedge fund portfolios holding KLAC at the end of Q2 2026, an increase from 71 in the prior quarter. ETF funds have been net sellers of KLAC in recent trading sessions, with outflows exceeding $40 million on consecutive days, though price action has remained under broader selling pressure.
Short-term supports tested as technical indicators reveal mixed momentum
KLAC is trading below its 20-day and 50-day moving averages ($189.37 and $188.1), suggesting a loss of short- and medium-term momentum. The price holds above the 200-day moving average at $180.02, which continues to act as longer-term support. Resistance is nearest at $183.41, with the Ichimoku Kijun at $187.29 forming a secondary ceiling. Intraday action shows sellers in control, as the stock trades close to session lows after opening with a sharp downside gap. Momentum indicators are mixed: the MACD gives a strong buy signal, while the ADX remains neutral and the RSI at 48.69 points to selling bias. Stochastic RSI at 0 and BBP at -0.07 both indicate oversold conditions, while the CCI and Awesome Oscillator give neutral readings. Volatility is elevated at 2.12%, and short-term technical divergence remains between some upward momentum signals and persistent selling pressure.
Earlier, analysts noted that while KLA's operational strength was evident, mixed technical signals and ongoing selling pressure contributed to near-term volatility. The current analysis highlights a deepening loss of momentum as sellers maintain control, making $180.02 a key support level to monitor for indications of further downside risk or potential stabilization.





Latest KLA Corporation News




-
 Afghanistan
-
 Albania
-
 Algeria
-
 Angola
-
 Argentina
-
 Armenia
-
 Australia
-
 Austria
-
 Azerbaijan
-
 Bahamas
-
 Bahrain
-
 Bangladesh
-
 Belarus
-
 Belgium
-
 Bolivia
-
 Botswana
-
 Brazil
-
 Brunei
-
 Bulgaria
-
 Cambodia
-
 Cameroon
-
 Canada
-
 Chile
Chile
-
 China
China
-
 Colombia
-
 Congo
Congo
-
 Costa Rica
-
 Cote d'Ivoire
-
 Croatia
-
 Cuba
Cuba
-
 Cyprus
-
 Czechia
-
 DR Congo
-
 Denmark
-
 Dominican Republic
-
 Ecuador
-
 Egypt
Egypt
-
 El Salvador
-
 Estonia
-
 Eswatini
-
 Ethiopia
-
 Finland
-
 France
-
 Georgia
-
 Germany
-
 Ghana
Ghana
-
 Greece
-
 Haiti
Haiti
-
 Hong Kong
-
 Hungary
-
 India
India
-
 Indonesia
-
 Iran, Islamic republic
-
 Iraq
Iraq
-
 Ireland
-
 Israel
-
 Italy
Italy
-
 Jamaica
-
 Japan
Japan
-
 Jordan
-
 Kazakhstan
-
 Kenya
Kenya
-
 Korea
Korea
-
 Kuwait
-
 Kyrgyzstan
-
 Laos
Laos
-
 Latvia
-
 Lebanon
-
 Lesotho
-
 Libya
Libya
-
 Lithuania
-
 Luxembourg
-
 Madagascar
-
 Malaysia
-
 Malta
Malta
-
 Mauritius
-
 Mexico
-
 Moldova
-
 Mongolia
-
 Montenegro
-
 Morocco
-
 Mozambique
-
 Myanmar
-
 Namibia
-
 Nepal
Nepal
-
 Netherlands
-
 New Zealand
-
 Nigeria
-
 North Macedonia
-
 Norway
-
 Oman
Oman
-
 Pakistan
-
 Palestine
-
 Panama
-
 Papua New Guinea
-
 Paraguay
-
 Peru
Peru
-
 Philippines
-
 Poland
-
 Portugal
-
 Puerto Rico
-
 Qatar
Qatar
-
 Reunion
-
 Romania
-
 Rwanda
-
 Saudi Arabia
-
 Serbia
-
 Singapore
-
 Slovakia
-
 Slovenia
-
 Somalia
-
 South Africa
-
 Spain
Spain
-
 Sri Lanka
-
 Sweden
-
 Switzerland
-
 Syria
Syria
-
 Taiwan
-
 Tajikistan
-
 Tanzania
-
 Thailand
-
 Trinidad and Tobago
-
 Tunisia
-
 Turkey
-
 UAE
UAE
-
 Uganda
-
 Ukraine
-
 United Kingdom
-
United States
-
 Uruguay
-
 Uzbekistan
-
 Venezuela
-
 Vietnam
-
 Yemen
Yemen
-
 Zambia
-
 Zimbabwe
- Forex
- Crypto












