

Intuit stock consolidation expected amid higher volatility and dividend boost: weekly analysis

Shares of Intuit Inc. (INTU) are trading near $307 after rising around 2% over the week as a recent rally has stalled in overbought conditions. Momentum on the chart is growing conflicted, with upside slowing just as technicals hint at increased hesitation. The coming week will test whether the bull move can persist or if sellers take advantage of the stretched setup.
 333.25
333.25
333.25
Highlights
- Shares of Intuit rose $4.16 over the past 7 days to $306.62, trading in the upper part of its recent range.
- The stock price remains above the 20-day average but trades below key long-term moving averages, indicating a bearish longer-term structure.
- Over the next five trading days, Intuit shares are expected to consolidate between $287.14 and $315.24, with a 36% probability of an increase and a 64% probability of a decrease.
Shareholder returns and product expansion bolster sentiment despite Mailchimp concerns
Intuit has been active with shareholder returns, repurchasing $5.5 billion in shares during fiscal 2026 and initiating a 15% dividend boost, according to Yahoo Finance. The company also declared a $1.38 dividend per share, with the ex-dividend date set for October 8 and payment scheduled for October 16, as reported by 24/7 Wall St. Expansion continued on the product front as MarketScreener noted the rollout of the Intuit Intelligence global platform for QuickBooks and Accountant Suite users. Outlook for the week remains shaped by strong performance in core segments, offset by concerns flagged about slower growth at Mailchimp (source: Yahoo Finance).
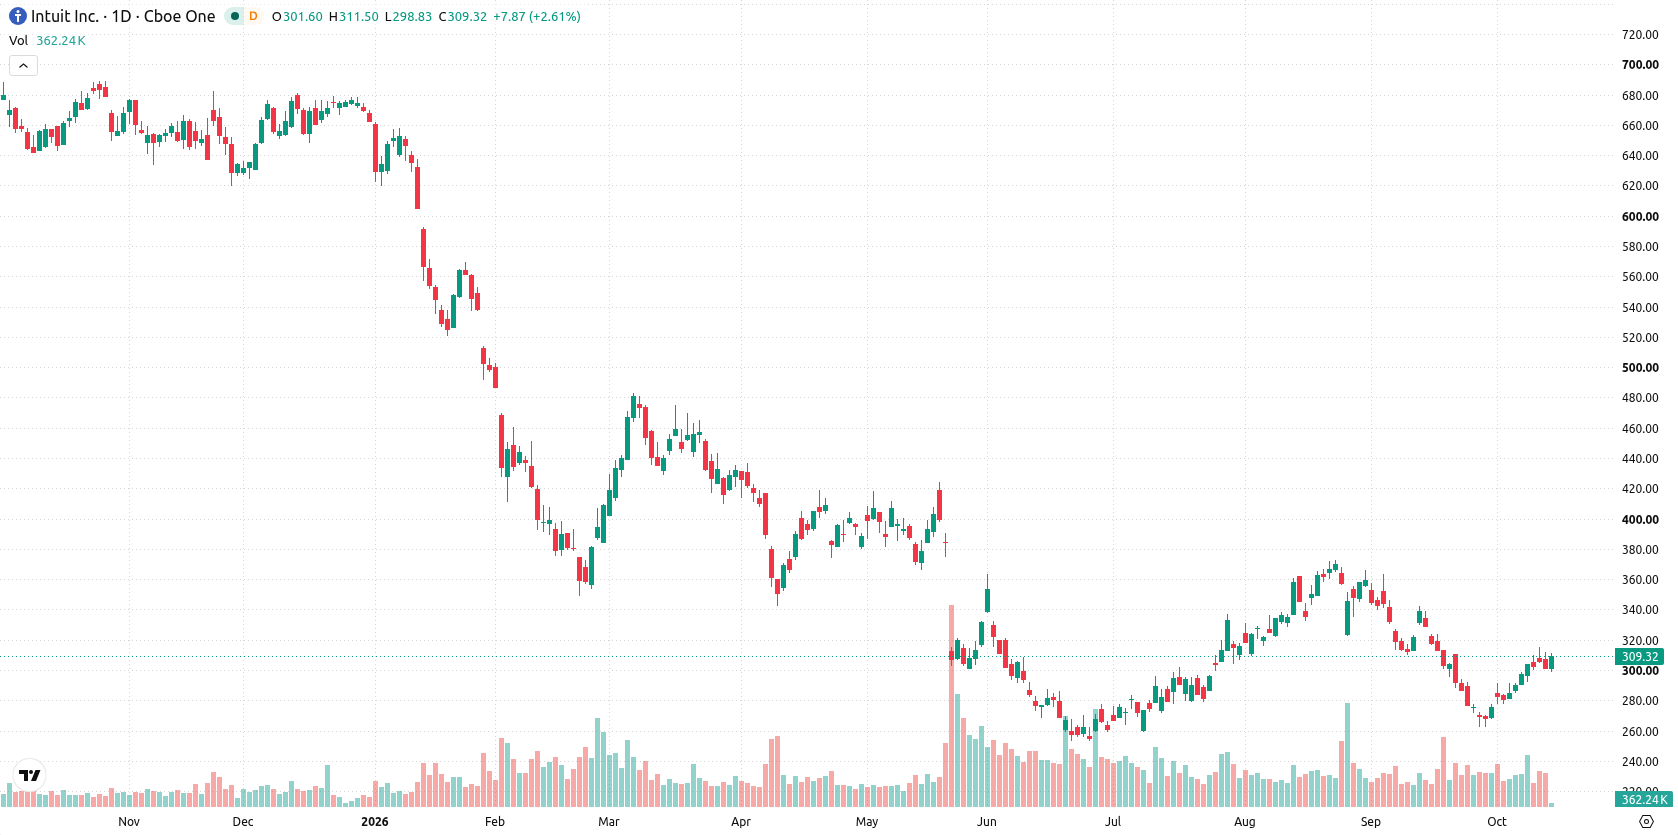
Volatility narrows as overbought Stochastic RSI meets bearish MACD signals
On the daily chart, the setup shows a contained move within a narrow range, supported by 6.61% weekly volatility. Momentum readings are mixed, with the Stochastic RSI in the overbought zone at 88.7, while both MACD and HMA signal further downside. Immediate support is at $301.7, marked by the Ichimoku Kijun, while resistance sits at $311.33. This mixed picture suggests a hesitancy to commit strongly in either direction just yet.
Consolidation likely next week unless key support or resistance breaks
Over the next five trading days, Intuit shares are expected to trade between $287.14 and $315.24. There is a 36% probability of an increase and a 64% probability of a decrease. Baseline expectations are for consolidation within this range. A break above the $311.33 resistance could clear the path for further short-term gains, while a drop below $301.7 support would increase near-term downside risk.
Previously it was reported that Intuit was building momentum as technical indicators and AI-driven product expansions suggested further upside potential. The current outlook introduces a more cautious stance due to mixed momentum signals and volatility, highlighting the $301.7 support and $311.33 resistance as levels for traders to monitor over the coming week.









-
 Afghanistan
-
 Albania
-
 Algeria
-
 Angola
-
 Argentina
-
 Armenia
-
 Australia
-
 Austria
-
 Azerbaijan
-
 Bahamas
-
 Bahrain
-
 Bangladesh
-
 Belarus
-
 Belgium
-
 Bolivia
-
 Botswana
-
 Brazil
-
 Brunei
-
 Bulgaria
-
 Cambodia
-
 Cameroon
-
 Canada
-
 Chile
Chile
-
 China
China
-
 Colombia
-
 Congo
Congo
-
 Costa Rica
-
 Cote d'Ivoire
-
 Croatia
-
 Cuba
Cuba
-
 Cyprus
-
 Czechia
-
 DR Congo
-
 Denmark
-
 Dominican Republic
-
 Ecuador
-
 Egypt
Egypt
-
 El Salvador
-
 Estonia
-
 Eswatini
-
 Ethiopia
-
 Finland
-
 France
-
 Georgia
-
 Germany
-
 Ghana
Ghana
-
 Greece
-
 Haiti
Haiti
-
 Hong Kong
-
 Hungary
-
 India
India
-
 Indonesia
-
 Iran, Islamic republic
-
 Iraq
Iraq
-
 Ireland
-
 Israel
-
 Italy
Italy
-
 Jamaica
-
 Japan
Japan
-
 Jordan
-
 Kazakhstan
-
 Kenya
Kenya
-
 Korea
Korea
-
 Kuwait
-
 Kyrgyzstan
-
 Laos
Laos
-
 Latvia
-
 Lebanon
-
 Lesotho
-
 Libya
Libya
-
 Lithuania
-
 Luxembourg
-
 Madagascar
-
 Malaysia
-
 Malta
Malta
-
 Mauritius
-
 Mexico
-
 Moldova
-
 Mongolia
-
 Montenegro
-
 Morocco
-
 Mozambique
-
 Myanmar
-
 Namibia
-
 Nepal
Nepal
-
 Netherlands
-
 New Zealand
-
 Nigeria
-
 North Macedonia
-
 Norway
-
 Oman
Oman
-
 Pakistan
-
 Palestine
-
 Panama
-
 Papua New Guinea
-
 Paraguay
-
 Peru
Peru
-
 Philippines
-
 Poland
-
 Portugal
-
 Puerto Rico
-
 Qatar
Qatar
-
 Reunion
-
 Romania
-
 Rwanda
-
 Saudi Arabia
-
 Serbia
-
 Singapore
-
 Slovakia
-
 Slovenia
-
 Somalia
-
 South Africa
-
 Spain
Spain
-
 Sri Lanka
-
 Sweden
-
 Switzerland
-
 Syria
Syria
-
 Taiwan
-
 Tajikistan
-
 Tanzania
-
 Thailand
-
 Trinidad and Tobago
-
 Tunisia
-
 Turkey
-
 UAE
UAE
-
 Uganda
-
 Ukraine
-
 United Kingdom
-
United States
-
 Uruguay
-
 Uzbekistan
-
 Venezuela
-
 Vietnam
-
 Yemen
Yemen
-
 Zambia
-
 Zimbabwe
- Forex
- Crypto












