


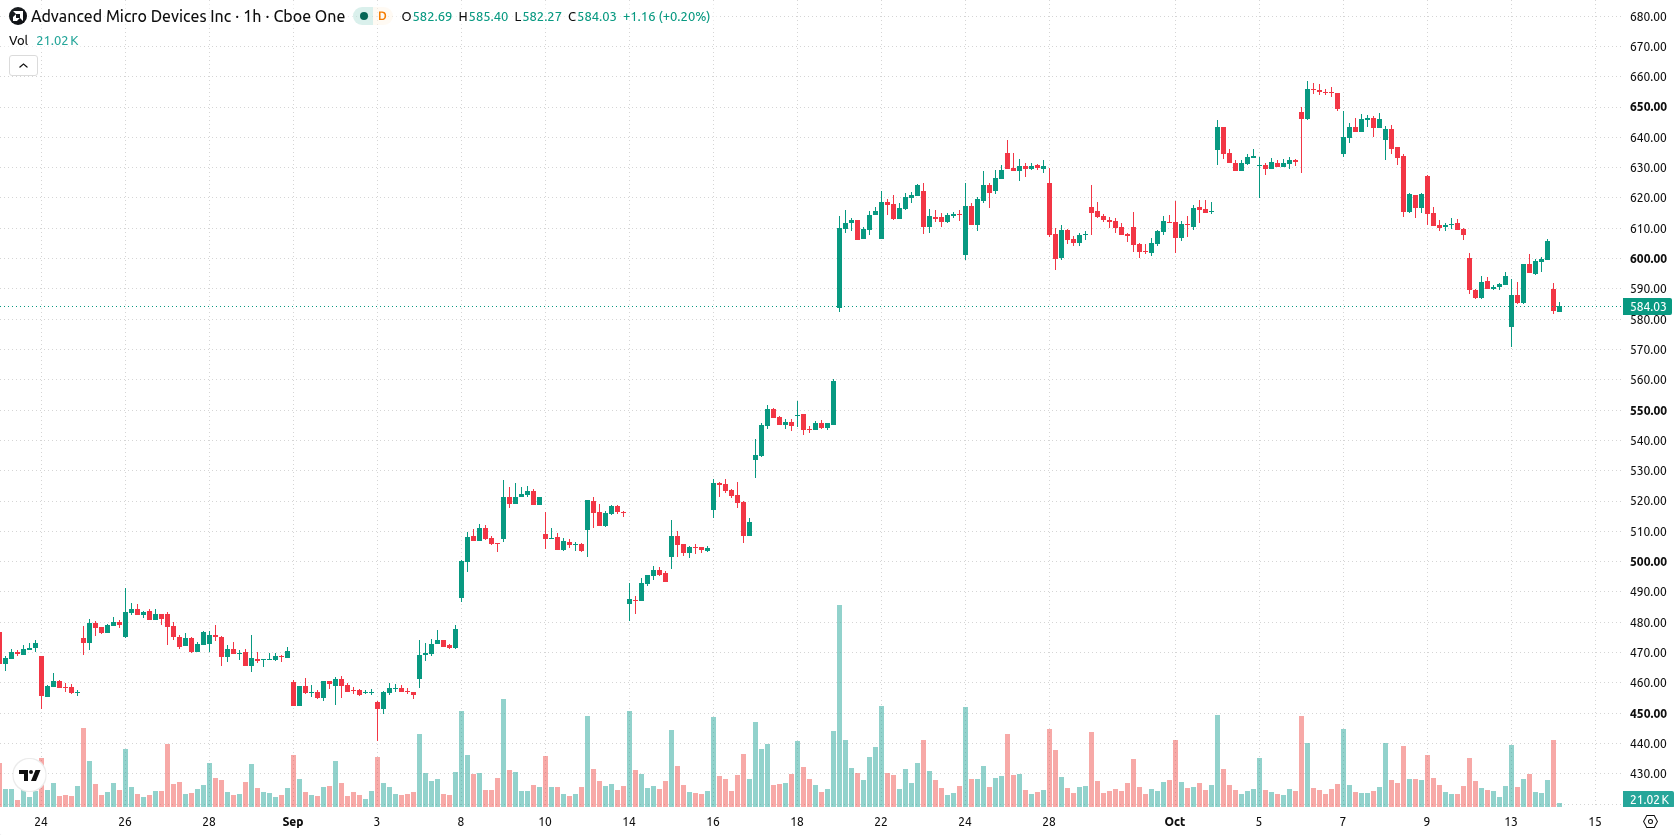
AMD (AMD) stock is trading at $583.98, down 3.56% on the day. The price remains below its key moving averages, indicating short-term and medium-term weakness in the current session.
 606.18
643.44
606.18
643.44
Highlights
- AMD introduced the Ryzen AI Halo Developer Platform with the new Ryzen AI Max+ PRO 495 processor, expanding capabilities for advanced AI workloads.
- The launch strengthens AMD's position in the developer and artificial intelligence compute markets but stock price remains under broad selling pressure.
- Shares of AMD trade below key short- and medium-term moving averages, with technical indicators confirming a bearish trend and a projected 557.71 to 620.49 trading range over the next 2 to 3 days.
AI platform launch boosts ambition amid persistent selling pressure
AMD has introduced the Ryzen AI Halo Developer Platform, which features the new Ryzen AI Max+ PRO 495 processor and supports up to 192GB of unified memory. The launch brings expanded processing capabilities targeted at advanced AI workloads and positions AMD to compete in the developer and artificial intelligence compute markets. While the product announcement broadens the company’s reach in next-generation computing platforms, price action has remained under broader selling pressure.
Mixed technical signals as resistance caps and buyers emerge intraday
On the hourly chart, AMD is trading below the MA-20 at $598.21 and the MA-50 at $621.89, with the long-term MA-200 at $389.15 providing underlying support. The immediate resistance is set by the Ichimoku Kijun level at $602.55. Momentum indicators are mixed: MACD signals a strong sell and ADX points to a bearish bias, yet RSI is at 52.46 and CCI also signal some buying pressure. Stochastic RSI indicates overbought conditions, and Bull/Bear Power shows buyers in control intraday, reflecting a divergence between short-term buying activity and prevailing weakness suggested by MACD and ADX.
Downside risk dominates as consolidation defines near-term outlook
Over the coming 2 to 3 trading days, AMD is expected to remain within a typical volatility band of $557.71 to $620.49. There is a 23% probability of an upward move and a 77% chance of further decline. The baseline scenario envisions price consolidating in this corridor. A bullish scenario would require a sustained break above $602.55 resistance, while a bearish scenario could unfold if support at $557.71 is breached, likely leading to an extended downward move.
Earlier, analysts noted that AMD was attempting to recover from a recent correction, with attention focused on both its AI developments and the importance of holding key price levels. The latest technical signals and product launch introduce further complexity, reinforcing the need for traders to monitor $557.71 as the next major support where downside risk could accelerate if breached.





Latest AMD News






-
 Afghanistan
-
 Albania
-
 Algeria
-
 Angola
-
 Argentina
-
 Armenia
-
 Australia
-
 Austria
-
 Azerbaijan
-
 Bahamas
-
 Bahrain
-
 Bangladesh
-
 Belarus
-
 Belgium
-
 Bolivia
-
 Botswana
-
 Brazil
-
 Brunei
-
 Bulgaria
-
 Cambodia
-
 Cameroon
-
 Canada
-
 Chile
Chile
-
 China
China
-
 Colombia
-
 Congo
Congo
-
 Costa Rica
-
 Cote d'Ivoire
-
 Croatia
-
 Cuba
Cuba
-
 Cyprus
-
 Czechia
-
 DR Congo
-
 Denmark
-
 Dominican Republic
-
 Ecuador
-
 Egypt
Egypt
-
 El Salvador
-
 Estonia
-
 Eswatini
-
 Ethiopia
-
 Finland
-
 France
-
 Georgia
-
 Germany
-
 Ghana
Ghana
-
 Greece
-
 Haiti
Haiti
-
 Hong Kong
-
 Hungary
-
 India
India
-
 Indonesia
-
 Iran, Islamic republic
-
 Iraq
Iraq
-
 Ireland
-
 Israel
-
 Italy
Italy
-
 Jamaica
-
 Japan
Japan
-
 Jordan
-
 Kazakhstan
-
 Kenya
Kenya
-
 Korea
Korea
-
 Kuwait
-
 Kyrgyzstan
-
 Laos
Laos
-
 Latvia
-
 Lebanon
-
 Lesotho
-
 Libya
Libya
-
 Lithuania
-
 Luxembourg
-
 Madagascar
-
 Malaysia
-
 Malta
Malta
-
 Mauritius
-
 Mexico
-
 Moldova
-
 Mongolia
-
 Montenegro
-
 Morocco
-
 Mozambique
-
 Myanmar
-
 Namibia
-
 Nepal
Nepal
-
 Netherlands
-
 New Zealand
-
 Nigeria
-
 North Macedonia
-
 Norway
-
 Oman
Oman
-
 Pakistan
-
 Palestine
-
 Panama
-
 Papua New Guinea
-
 Paraguay
-
 Peru
Peru
-
 Philippines
-
 Poland
-
 Portugal
-
 Puerto Rico
-
 Qatar
Qatar
-
 Reunion
-
 Romania
-
 Rwanda
-
 Saudi Arabia
-
 Serbia
-
 Singapore
-
 Slovakia
-
 Slovenia
-
 Somalia
-
 South Africa
-
 Spain
Spain
-
 Sri Lanka
-
 Sweden
-
 Switzerland
-
 Syria
Syria
-
 Taiwan
-
 Tajikistan
-
 Tanzania
-
 Thailand
-
 Trinidad and Tobago
-
 Tunisia
-
 Turkey
-
 UAE
UAE
-
 Uganda
-
 Ukraine
-
 United Kingdom
-
United States
-
 Uruguay
-
 Uzbekistan
-
 Venezuela
-
 Vietnam
-
 Yemen
Yemen
-
 Zambia
-
 Zimbabwe
- Forex
- Crypto












