


Barrick Gold Corporation (ABX) surged 3.06% in a technical rebound driven by oversold conditions across multiple momentum indicators and the emergence of firm intraday buying interest. This upward move looks limited, with price action still held below all major moving averages, signaling the broader trend remains under downside pressure.
 58.43
58.53
58.43
58.53
Highlights
- Shares of Barrick Gold trade below major moving averages, showing sustained downward pressure across timeframes.
- Technical indicators, including MACD, RSI and CCI, point to weak momentum and broadly oversold conditions.
- Expected price range for the next five sessions is C$54.95 to C$59.15, with a high probability of further downside.
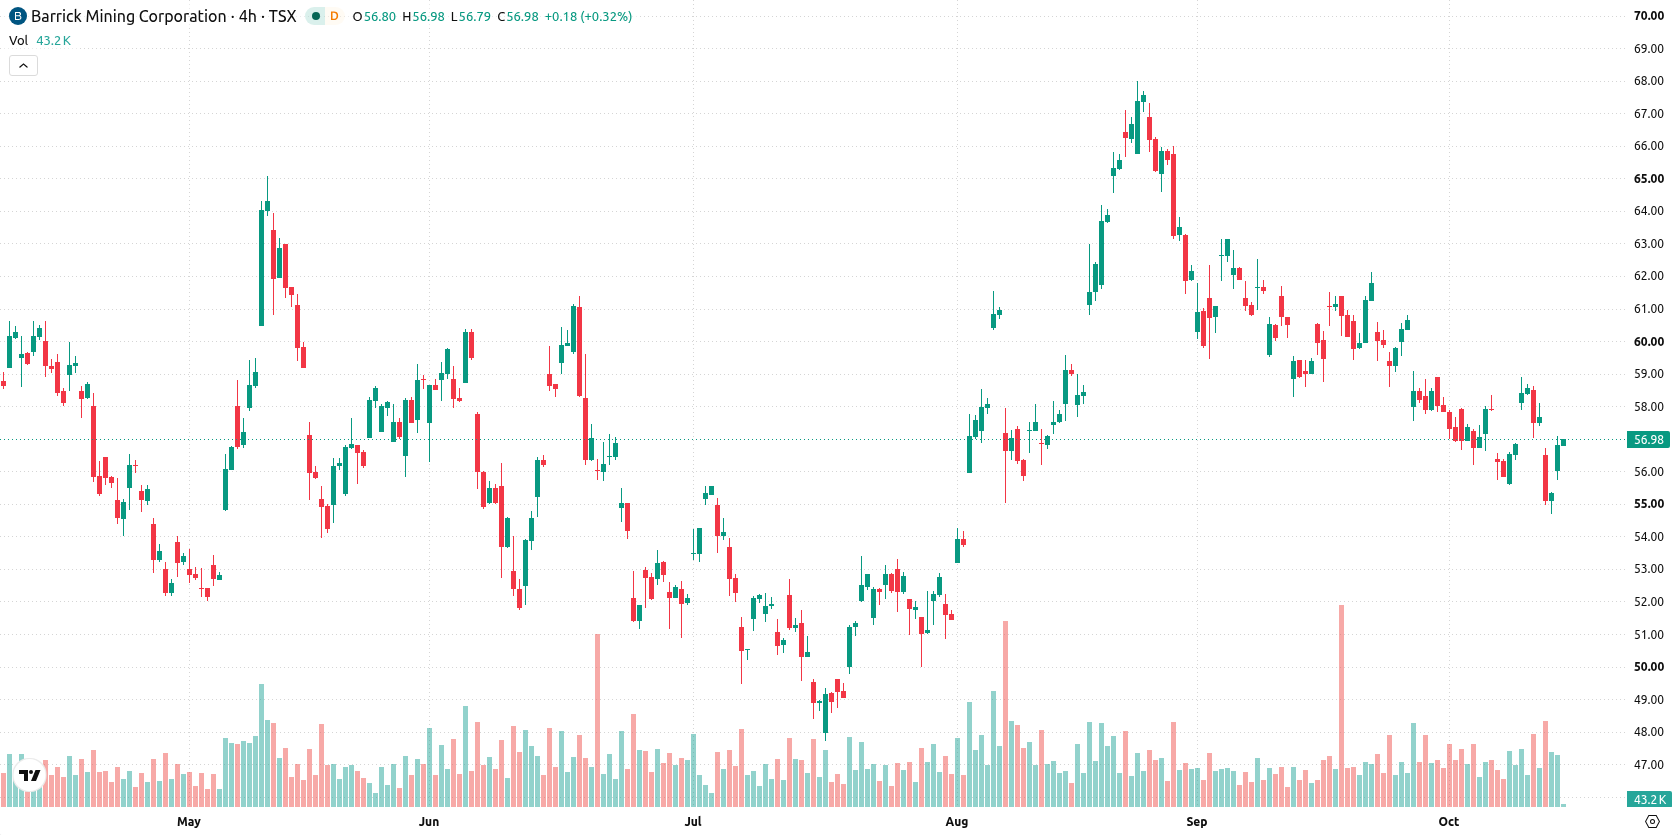
Downside pressure persists as moving averages and indicators show weakness
Barrick Gold is trading below all its major moving averages: C$58.57 (MA-20), C$59.88 (MA-50), and C$59.12 (MA-200), reflecting ongoing downward pressure in the short, medium, and long term. The next key resistance is the Ichimoku Kijun at C$58.53, with support at the session high near C$56.2. MA-50 alignment over MA-200 confirms the longer-term bullish structure, though price action is currently soft. Momentum remains weak, with MACD signaling a sell bias and the ADX suggesting a lack of clear trend strength. Both the RSI and CCI highlight oversold conditions, as does the Stochastic RSI, while Bull/Bear Power confirms sellers are dominant intraday with additional oversold indication. The Awesome Oscillator is neutral.
Earlier, analysts noted that Barrick Gold faced persistent technical weakness and ongoing downside risk. The current analysis strengthens this cautious outlook, highlighting the importance of monitoring C$58.53 as a key resistance level that could determine the next directional move.





Latest Barrick Gold News





-
 Afghanistan
-
 Albania
-
 Algeria
-
 Angola
-
 Argentina
-
 Armenia
-
 Australia
-
 Austria
-
 Azerbaijan
-
 Bahamas
-
 Bahrain
-
 Bangladesh
-
 Belarus
-
 Belgium
-
 Bolivia
-
 Botswana
-
 Brazil
-
 Brunei
-
 Bulgaria
-
 Cambodia
-
 Cameroon
-
 Canada
-
 Chile
Chile
-
 China
China
-
 Colombia
-
 Congo
Congo
-
 Costa Rica
-
 Cote d'Ivoire
-
 Croatia
-
 Cuba
Cuba
-
 Cyprus
-
 Czechia
-
 DR Congo
-
 Denmark
-
 Dominican Republic
-
 Ecuador
-
 Egypt
Egypt
-
 El Salvador
-
 Estonia
-
 Eswatini
-
 Ethiopia
-
 Finland
-
 France
-
 Georgia
-
 Germany
-
 Ghana
Ghana
-
 Greece
-
 Haiti
Haiti
-
 Hong Kong
-
 Hungary
-
 India
India
-
 Indonesia
-
 Iran, Islamic republic
-
 Iraq
Iraq
-
 Ireland
-
 Israel
-
 Italy
Italy
-
 Jamaica
-
 Japan
Japan
-
 Jordan
-
 Kazakhstan
-
 Kenya
Kenya
-
 Korea
Korea
-
 Kuwait
-
 Kyrgyzstan
-
 Laos
Laos
-
 Latvia
-
 Lebanon
-
 Lesotho
-
 Libya
Libya
-
 Lithuania
-
 Luxembourg
-
 Madagascar
-
 Malaysia
-
 Malta
Malta
-
 Mauritius
-
 Mexico
-
 Moldova
-
 Mongolia
-
 Montenegro
-
 Morocco
-
 Mozambique
-
 Myanmar
-
 Namibia
-
 Nepal
Nepal
-
 Netherlands
-
 New Zealand
-
 Nigeria
-
 North Macedonia
-
 Norway
-
 Oman
Oman
-
 Pakistan
-
 Palestine
-
 Panama
-
 Papua New Guinea
-
 Paraguay
-
 Peru
Peru
-
 Philippines
-
 Poland
-
 Portugal
-
 Puerto Rico
-
 Qatar
Qatar
-
 Reunion
-
 Romania
-
 Rwanda
-
 Saudi Arabia
-
 Serbia
-
 Singapore
-
 Slovakia
-
 Slovenia
-
 Somalia
-
 South Africa
-
 Spain
Spain
-
 Sri Lanka
-
 Sweden
-
 Switzerland
-
 Syria
Syria
-
 Taiwan
-
 Tajikistan
-
 Tanzania
-
 Thailand
-
 Trinidad and Tobago
-
 Tunisia
-
 Turkey
-
 UAE
UAE
-
 Uganda
-
 Ukraine
-
 United Kingdom
-
United States
-
 Uruguay
-
 Uzbekistan
-
 Venezuela
-
 Vietnam
-
 Yemen
Yemen
-
 Zambia
-
 Zimbabwe
- Forex
- Crypto












