

Interactive Brokers stock outlook: Consolidation likely unless $80.21 support breaks

Interactive Brokers (IBKR) stock is trading at $83.79 after a 2.6% loss today, ending near its session low. The price remains below its key short- and medium-term moving averages while holding above its long-term average, pointing to underlying support despite continued near-term weakness.
 86.95
89.05
86.95
89.05
Highlights
- Interactive Brokers Group reported record third quarter pre-tax profit with a 78% margin and raised its annual dividend by 71% to $0.60 per share.
- Net interest income rose 19% and commission revenue increased 12% year-over-year as customer accounts expanded by over 30% and client assets reached $243 billion.
- Shares of Interactive Brokers trade below key moving averages with negative momentum indicators, a projected 2-3 day range of $80.21 to $87.37 and high probability of further downside.
Fundamentals strengthen as record profit and expansion meet selling
Interactive Brokers Group reported record pre-tax profit for the third quarter of 2026 with a 78% pre-tax margin and implemented a 71% increase in its annual dividend to $0.60 per share, according to Finance Biggo. This was accompanied by a 19% rise in net interest income and a 12% increase in commission revenue year-over-year, while customer accounts expanded by over 30% and client assets reached $243 billion as reported by TradingKey. The company also launched autonomous AI trading for approximately 3,000 clients and formed a new partnership with Daol Investment & Securities in South Korea to offer global securities trading powered by its infrastructure, according to Benzinga. These developments reflect fundamental improvements and business expansion, though price action has remained under broader selling pressure.
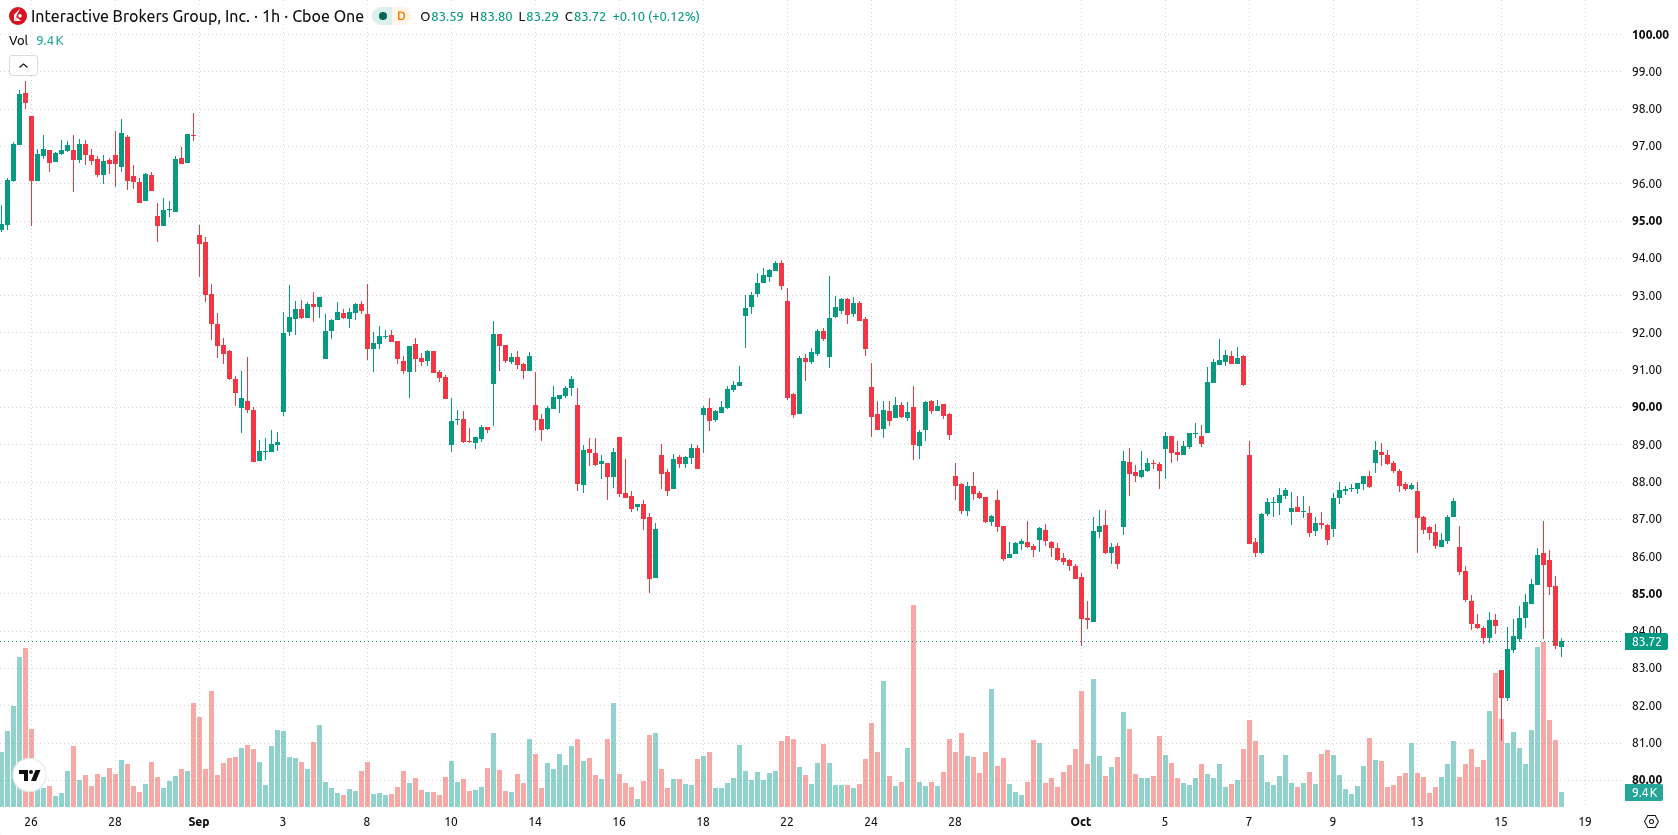
Technical support holds as momentum stays negative near resistance
IBKR remains below the MA-20 and MA-50, highlighting recent weakness, but sits above the longer-term MA-200 at $82.31, which offers notable technical support. Immediate upside is capped by the Ichimoku Kijun at $84.79, establishing a near-term resistance level. Momentum indicators lean negative: MACD remains on Strong Sell, ADX on Sell, and RSI sits at 48.93 with a Sell classification. CCI is Neutral and the Awesome Oscillator is also Neutral, while Stochastic RSI and Bull/Bear Power are both Overbought, suggesting some intraday buyer activity but also possible exhaustion versus the prevailing downward momentum.
Consolidation likely as volatility frames breakout and breakdown risks
Over the next 2-3 trading days, the expected price range for IBKR is $80.21 to $87.37, reflecting a typical volatility band relative to current levels. The baseline scenario anticipates consolidation between support and resistance. A sustained move above $84.79 could invite short covering and push the stock toward the upper end of the range. Conversely, a break below $80.21 would likely confirm downside momentum and expose IBKR to further losses in the near term.
Earlier, analysts noted that Interactive Brokers faced sustained technical weakness and heightened downside risk despite product expansion initiatives. The current update adds further evidence of fundamental improvement, but with near-term momentum still negative, traders should closely monitor the $80.21 support and $84.79 resistance as key levels for a potential direction shift.





Latest Interactive Brokers News





-
 Afghanistan
-
 Albania
-
 Algeria
-
 Angola
-
 Argentina
-
 Armenia
-
 Australia
-
 Austria
-
 Azerbaijan
-
 Bahamas
-
 Bahrain
-
 Bangladesh
-
 Belarus
-
 Belgium
-
 Bolivia
-
 Botswana
-
 Brazil
-
 Brunei
-
 Bulgaria
-
 Cambodia
-
 Cameroon
-
 Canada
-
 Chile
Chile
-
 China
China
-
 Colombia
-
 Congo
Congo
-
 Costa Rica
-
 Cote d'Ivoire
-
 Croatia
-
 Cuba
Cuba
-
 Cyprus
-
 Czechia
-
 DR Congo
-
 Denmark
-
 Dominican Republic
-
 Ecuador
-
 Egypt
Egypt
-
 El Salvador
-
 Estonia
-
 Eswatini
-
 Ethiopia
-
 Finland
-
 France
-
 Georgia
-
 Germany
-
 Ghana
Ghana
-
 Greece
-
 Haiti
Haiti
-
 Hong Kong
-
 Hungary
-
 India
India
-
 Indonesia
-
 Iran, Islamic republic
-
 Iraq
Iraq
-
 Ireland
-
 Israel
-
 Italy
Italy
-
 Jamaica
-
 Japan
Japan
-
 Jordan
-
 Kazakhstan
-
 Kenya
Kenya
-
 Korea
Korea
-
 Kuwait
-
 Kyrgyzstan
-
 Laos
Laos
-
 Latvia
-
 Lebanon
-
 Lesotho
-
 Libya
Libya
-
 Lithuania
-
 Luxembourg
-
 Madagascar
-
 Malaysia
-
 Malta
Malta
-
 Mauritius
-
 Mexico
-
 Moldova
-
 Mongolia
-
 Montenegro
-
 Morocco
-
 Mozambique
-
 Myanmar
-
 Namibia
-
 Nepal
Nepal
-
 Netherlands
-
 New Zealand
-
 Nigeria
-
 North Macedonia
-
 Norway
-
 Oman
Oman
-
 Pakistan
-
 Palestine
-
 Panama
-
 Papua New Guinea
-
 Paraguay
-
 Peru
Peru
-
 Philippines
-
 Poland
-
 Portugal
-
 Puerto Rico
-
 Qatar
Qatar
-
 Reunion
-
 Romania
-
 Rwanda
-
 Saudi Arabia
-
 Serbia
-
 Singapore
-
 Slovakia
-
 Slovenia
-
 Somalia
-
 South Africa
-
 Spain
Spain
-
 Sri Lanka
-
 Sweden
-
 Switzerland
-
 Syria
Syria
-
 Taiwan
-
 Tajikistan
-
 Tanzania
-
 Thailand
-
 Trinidad and Tobago
-
 Tunisia
-
 Turkey
-
 UAE
UAE
-
 Uganda
-
 Ukraine
-
 United Kingdom
-
United States
-
 Uruguay
-
 Uzbekistan
-
 Venezuela
-
 Vietnam
-
 Yemen
Yemen
-
 Zambia
-
 Zimbabwe
- Forex
- Crypto












