

BP shares technical analysis: Range-bound trading with support at GBX609.64

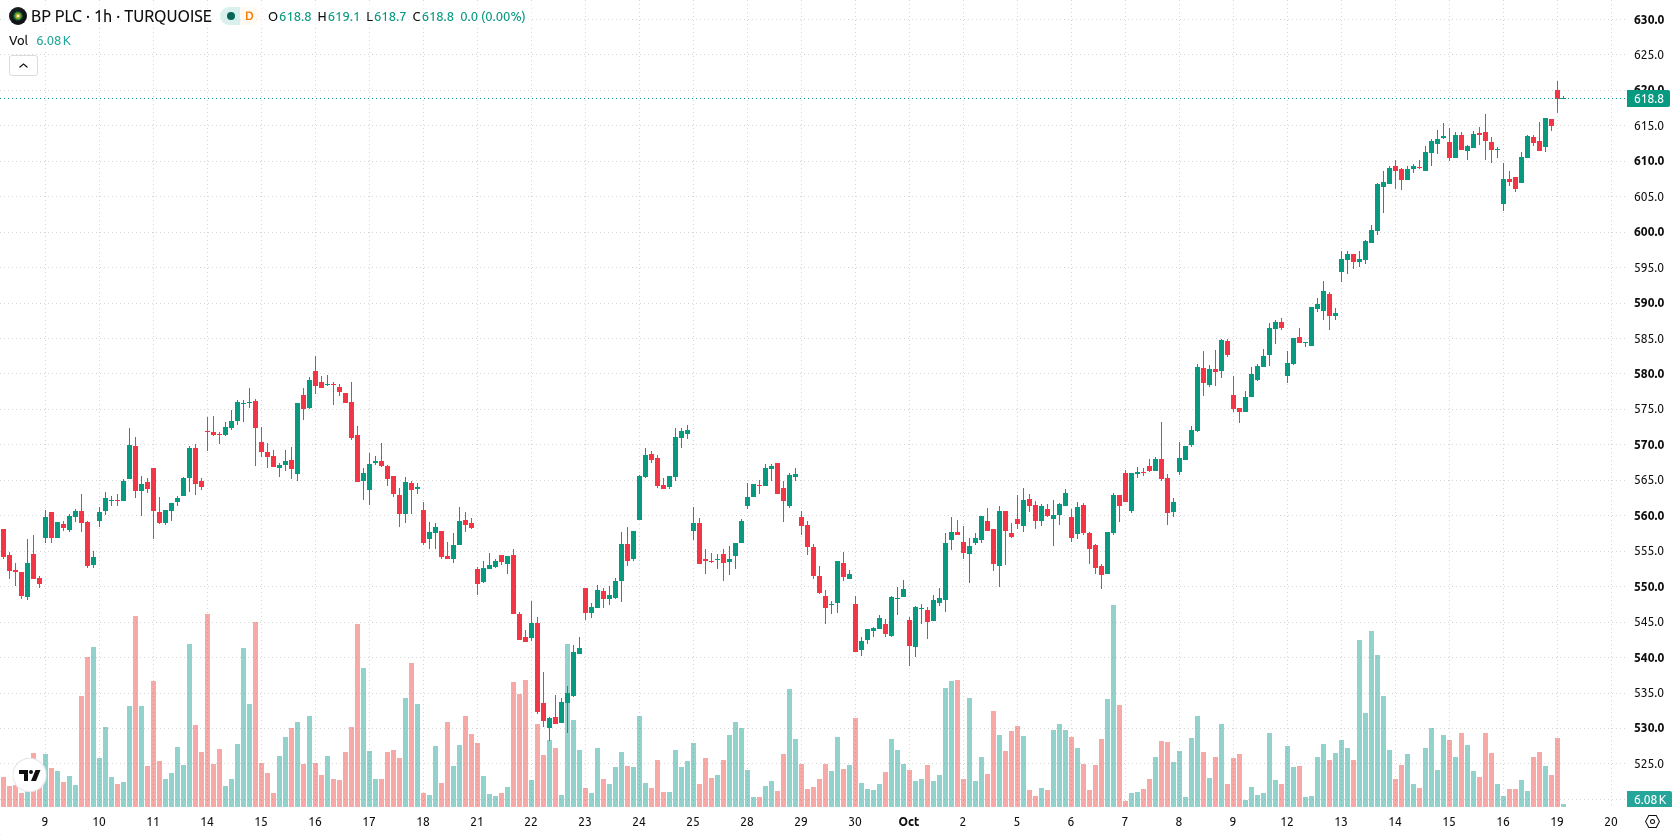
BP (BP) stock is trading at GBX615, posting a modest gain on the day. The shares sit above their key moving averages, reflecting general price strength relative to recent trends.
 618.70
638.00
Highlights
- BP shares exhibit a bullish trend across all timeframes, trading above key moving averages on hourly and daily charts.
- Momentum indicators predominantly give buy signals with intraday price strength, though some show signs of overbought conditions near the highs.
- BP stock is forecast to consolidate in the GBX597.92 to GBX632.08 range with a 77% probability of upward movement in the coming sessions.
Momentum signals reinforce bullish bias amid overbought warning
On the hourly chart, BP trades above both the MA-20 at GBX611.93 and the MA-50 at GBX602.35, while on the daily chart, it remains above the MA-200 at GBX523.68. The Ichimoku Kijun sits at GBX609.64, providing immediate support. Among momentum indicators, MACD issues a strong buy signal and ADX is in buy territory. RSI is currently at 62.3, indicating active buying without reaching traditional overbought levels; Stochastic RSI is neutral, while CCI is overbought. Bull/Bear Power reflects strong buyer intraday dominance, and the Awesome Oscillator aligns with this bullish momentum profile. While most signals affirm price strength, overbought CCI warns of possible near-term resistance at current highs.
Consolidation or rally favored as breakout risk persists
BP is likely to trade within a GBX597.92 to GBX632.08 volatility band over the coming sessions. There is a 77% probability for prices to consolidate or move higher, with just a 23% likelihood of a downside move. The base case sees prices holding within this corridor; a bullish breakout above resistance could extend the rally, while a drop below the Ichimoku Kijun and lower range bound would open the door to deeper retracement.
Earlier, analysts noted that BP shares maintained a constructive technical posture, with bullish momentum persisting despite some early signs of overbought conditions. The current analysis builds on this by highlighting continued technical strength but also cautions that an overbought CCI now points to possible resistance, making the Ichimoku Kijun a key short-term level for traders to monitor.











-
 Afghanistan
-
 Albania
-
 Algeria
-
 Angola
-
 Argentina
-
 Armenia
-
 Australia
-
 Austria
-
 Azerbaijan
-
 Bahamas
-
 Bahrain
-
 Bangladesh
-
 Belarus
-
 Belgium
-
 Bolivia
-
 Botswana
-
 Brazil
-
 Brunei
-
 Bulgaria
-
 Cambodia
-
 Cameroon
-
 Canada
-
 Chile
-
 China
-
 Colombia
-
 Congo
-
 Costa Rica
-
 Cote d'Ivoire
-
 Croatia
-
 Cuba
-
 Cyprus
-
 Czechia
-
 DR Congo
-
 Denmark
-
 Dominican Republic
-
 Ecuador
-
 Egypt
-
 El Salvador
-
 Estonia
-
 Eswatini
-
 Ethiopia
-
 Finland
-
 France
-
 Georgia
-
 Germany
-
 Ghana
-
 Greece
-
 Haiti
-
 Hong Kong
-
 Hungary
-
 India
-
 Indonesia
-
 Iran, Islamic republic
-
 Iraq
-
 Ireland
-
 Israel
-
 Italy
-
 Jamaica
-
 Japan
-
 Jordan
-
 Kazakhstan
-
 Kenya
-
 Korea
-
 Kuwait
-
 Kyrgyzstan
-
 Laos
-
 Latvia
-
 Lebanon
-
 Lesotho
-
 Libya
-
 Lithuania
-
 Luxembourg
-
 Madagascar
-
 Malaysia
-
 Malta
-
 Mauritius
-
 Mexico
-
 Moldova
-
 Mongolia
-
 Montenegro
-
 Morocco
-
 Mozambique
-
 Myanmar
-
 Namibia
-
 Nepal
-
 Netherlands
-
 New Zealand
-
 Nigeria
-
 North Macedonia
-
 Norway
-
 Oman
-
 Pakistan
-
 Palestine
-
 Panama
-
 Papua New Guinea
-
 Paraguay
-
 Peru
-
 Philippines
-
 Poland
-
 Portugal
-
 Puerto Rico
-
 Qatar
-
 Reunion
-
 Romania
-
 Rwanda
-
 Saudi Arabia
-
 Serbia
-
 Singapore
-
 Slovakia
-
 Slovenia
-
 Somalia
-
 South Africa
-
 Spain
-
 Sri Lanka
-
 Sweden
-
 Switzerland
-
 Syria
-
 Taiwan
-
 Tajikistan
-
 Tanzania
-
 Thailand
-
 Trinidad and Tobago
-
 Tunisia
-
 Turkey
-
 UAE
-
 Uganda
-
 Ukraine
-
 United Kingdom
-
United States
-
 Uruguay
-
 Uzbekistan
-
 Venezuela
-
 Vietnam
-
 Yemen
-
 Zambia
-
 Zimbabwe
- Forex
- Crypto












