

Salesforce stock weekly forecast: Consolidation persists with overbought CCI signaling buyer pressure

Shares of Salesforce, Inc. (CRM) are trading near $239 as the recent recovery holds, with price action steady and little movement over the past week. Investors continue to weigh upbeat corporate momentum against signs of a stretched setup. This week, all eyes turn to how the company’s latest product and AI integrations will shape the outlook for CRM.
 233.00
248.80
Highlights
- Shares of Salesforce edged lower by $2.07 over the past week to $238.67, remaining above key short-term averages.
- Daily chart signals show a consolidation phase with volatility at 6.1% and mixed momentum readings indicating buyer exhaustion.
- Over the next five days, Salesforce is projected to trade between $232.29 and $245.04 with initial support at $233.65 and resistance at $241.36.
AI-driven deal activity and product launches reinforce growth outlook this week
Salesforce completed its acquisition of the AI analytics platform Loops for approximately $30 million to bolster the AI capabilities of Tableau, according to Benzinga. The company recently launched Hunter, an AI-powered outbound sales agent with integrations to platforms like Demandbase, ZoomInfo, and Docusign, further expanding CRM's workflow and data ecosystem as reported by Yahoo Finance. Guidance for fiscal 2027 was reaffirmed, projecting annual revenue between $46.1 billion and $46.4 billion, and recent quarters reflected ongoing capital returns through dividends and the $25 billion share repurchase program.
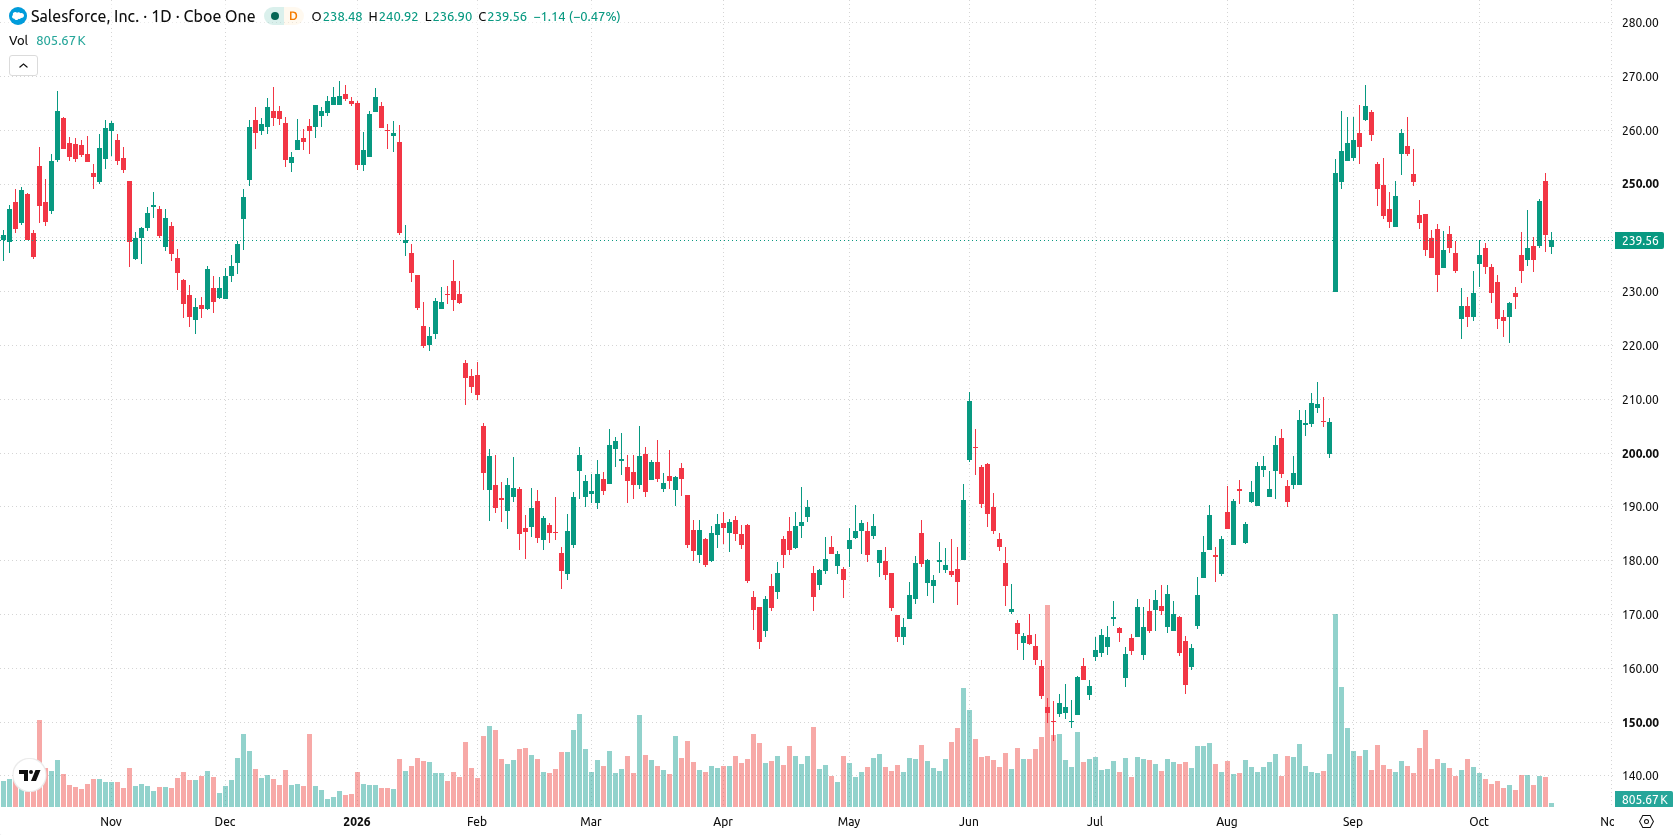
Range-bound momentum prevails as buyer exhaustion tempers post-rebound gains
On the daily chart, the setup shows consolidation continuing, with the stock posting 6.1% volatility and price action holding within a contained move within a narrow range. Momentum signals are mixed: RSI remains in the neutral zone at 55.85, while CCI is elevated in overbought territory at 110.19, pointing to some buyer exhaustion. Initial support is identified at $233.65 and the nearest resistance comes from the Ichimoku Kijun at $241.36. This range-bound action suggests the stock is pausing after recent gains without committing to a fresh directional move.
Upside bias persists barring a key range breakout in the coming week
Over the next five trading days, Salesforce is expected to trade between $232.29 and $245.04. There is a 73% probability of an increase and a 27% probability of a decrease. The base case sees the stock contained between support at $233.65 and resistance at $241.36. A break above $241.36 may fuel a push toward the upper end of the expected range, while a slip below $233.65 would open room for a deeper retracement toward the lower boundary near $232.29.
Earlier, analysts noted that Salesforce maintained a bullish technical structure supported by growth initiatives and major contract wins, despite short-term consolidation. The current analysis adds a new dimension by highlighting continued consolidation and mixed momentum signals, with attention now focused on whether a breakout above $241.36 or a slide below $233.65 will determine the stock's next significant move.






Latest Salesforce News




-
 Afghanistan
-
 Albania
-
 Algeria
-
 Angola
-
 Argentina
-
 Armenia
-
 Australia
-
 Austria
-
 Azerbaijan
-
 Bahamas
-
 Bahrain
-
 Bangladesh
-
 Belarus
-
 Belgium
-
 Bolivia
-
 Botswana
-
 Brazil
-
 Brunei
-
 Bulgaria
-
 Cambodia
-
 Cameroon
-
 Canada
-
 Chile
-
 China
-
 Colombia
-
 Congo
-
 Costa Rica
-
 Cote d'Ivoire
-
 Croatia
-
 Cuba
-
 Cyprus
-
 Czechia
-
 DR Congo
-
 Denmark
-
 Dominican Republic
-
 Ecuador
-
 Egypt
-
 El Salvador
-
 Estonia
-
 Eswatini
-
 Ethiopia
-
 Finland
-
 France
-
 Georgia
-
 Germany
-
 Ghana
-
 Greece
-
 Haiti
-
 Hong Kong
-
 Hungary
-
 India
-
 Indonesia
-
 Iran, Islamic republic
-
 Iraq
-
 Ireland
-
 Israel
-
 Italy
-
 Jamaica
-
 Japan
-
 Jordan
-
 Kazakhstan
-
 Kenya
-
 Korea
-
 Kuwait
-
 Kyrgyzstan
-
 Laos
-
 Latvia
-
 Lebanon
-
 Lesotho
-
 Libya
-
 Lithuania
-
 Luxembourg
-
 Madagascar
-
 Malaysia
-
 Malta
-
 Mauritius
-
 Mexico
-
 Moldova
-
 Mongolia
-
 Montenegro
-
 Morocco
-
 Mozambique
-
 Myanmar
-
 Namibia
-
 Nepal
-
 Netherlands
-
 New Zealand
-
 Nigeria
-
 North Macedonia
-
 Norway
-
 Oman
-
 Pakistan
-
 Palestine
-
 Panama
-
 Papua New Guinea
-
 Paraguay
-
 Peru
-
 Philippines
-
 Poland
-
 Portugal
-
 Puerto Rico
-
 Qatar
-
 Reunion
-
 Romania
-
 Rwanda
-
 Saudi Arabia
-
 Serbia
-
 Singapore
-
 Slovakia
-
 Slovenia
-
 Somalia
-
 South Africa
-
 Spain
-
 Sri Lanka
-
 Sweden
-
 Switzerland
-
 Syria
-
 Taiwan
-
 Tajikistan
-
 Tanzania
-
 Thailand
-
 Trinidad and Tobago
-
 Tunisia
-
 Turkey
-
 UAE
-
 Uganda
-
 Ukraine
-
 United Kingdom
-
United States
-
 Uruguay
-
 Uzbekistan
-
 Venezuela
-
 Vietnam
-
 Yemen
-
 Zambia
-
 Zimbabwe
- Forex
- Crypto












