

AEM trades sideways as weak momentum limits breakout above C$276.14 resistance

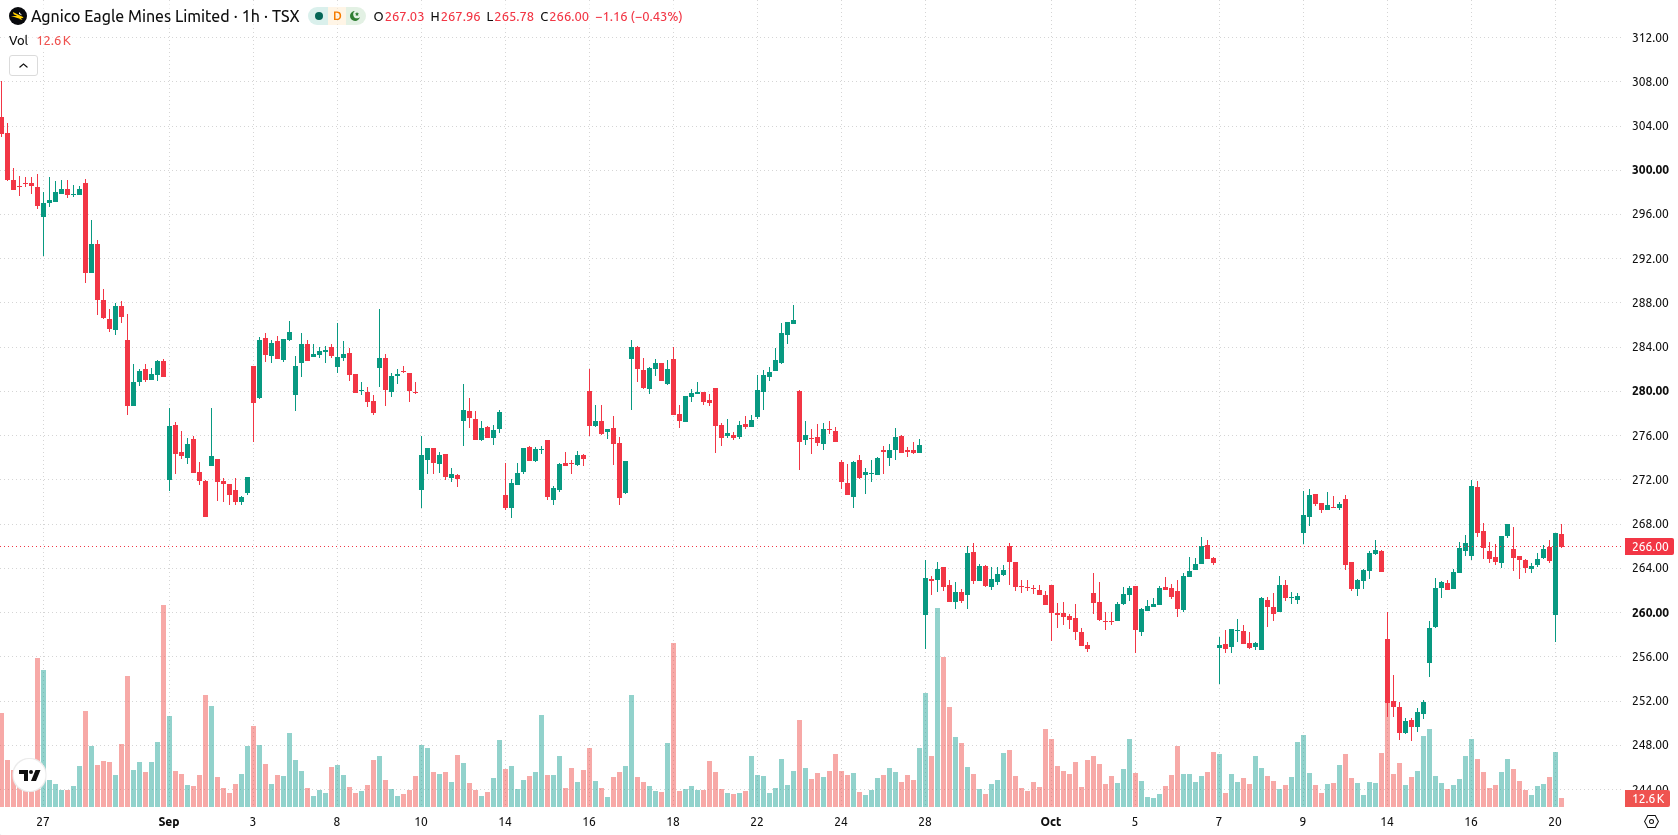
Agnico Eagle Mines (AEM) stock is trading at C$265.68 after a modest rise in the latest session. The price currently sits above its key moving averages on both the hourly and daily charts.
 236.84
256.51
Highlights
- AEM/CAD maintains a bullish structure across short, medium, and long-term timeframes, trading above key averages.
- Momentum indicators are mixed, with strong buying momentum showing but weak trend conviction and intraday buyer dominance.
- Shares trade near the session high at C$265.68 with expected short-term range of C$255.22 to C$276.14 and a 67% probability for a downward move.
Momentum mixed as price holds key support and highs
On the technical front, AEM is trading above its MA-20 at C$265.25 and MA-50 at C$262.82 (hourly chart), while also holding above the MA-200 at C$263.21 on the daily timeframe. The Ichimoku Kijun level is providing immediate support at C$260.13. Momentum readings are mixed: MACD points to strong buying momentum, while ADX is neutral. RSI stands at 52.35, indicating mild bullish momentum, Stochastic RSI is oversold, CCI is neutral, and Bull/Bear Power suggests overbought conditions. The Awesome Oscillator also remains supportive of current upside moves, and trading is occurring near the session's highs with moderate volatility.
Higher downside risk as trading remains range-bound
In the near term, AEM is expected to remain contained within a C$255.22−C$276.14 range, reflecting its typical volatility band relative to current levels. There is a 33% chance of an upward breakout above resistance, while the probability of a move lower is higher at 67%, suggesting that range-bound or sideways trading is the base case. A bullish scenario would require a decisive break above resistance, whereas a sustained move below current support would tilt the outlook bearish.
Earlier, analysts noted that Agnico Eagle Mines was exhibiting upward momentum while highlighting ongoing institutional accumulation despite mixed technical signals. The current analysis adds that with momentum readings now mixed and volatility persisting near session highs, investors should watch for a potential breakout from the C$255.22−C$276.14 range as the next catalyst for direction.










-
 Afghanistan
-
 Albania
-
 Algeria
-
 Angola
-
 Argentina
-
 Armenia
-
 Australia
-
 Austria
-
 Azerbaijan
-
 Bahamas
-
 Bahrain
-
 Bangladesh
-
 Belarus
-
 Belgium
-
 Bolivia
-
 Botswana
-
 Brazil
-
 Brunei
-
 Bulgaria
-
 Cambodia
-
 Cameroon
-
 Canada
-
 Chile
-
 China
-
 Colombia
-
 Congo
-
 Costa Rica
-
 Cote d'Ivoire
-
 Croatia
-
 Cuba
-
 Cyprus
-
 Czechia
-
 DR Congo
-
 Denmark
-
 Dominican Republic
-
 Ecuador
-
 Egypt
-
 El Salvador
-
 Estonia
-
 Eswatini
-
 Ethiopia
-
 Finland
-
 France
-
 Georgia
-
 Germany
-
 Ghana
-
 Greece
-
 Haiti
-
 Hong Kong
-
 Hungary
-
 India
-
 Indonesia
-
 Iran, Islamic republic
-
 Iraq
-
 Ireland
-
 Israel
-
 Italy
-
 Jamaica
-
 Japan
-
 Jordan
-
 Kazakhstan
-
 Kenya
-
 Korea
-
 Kuwait
-
 Kyrgyzstan
-
 Laos
-
 Latvia
-
 Lebanon
-
 Lesotho
-
 Libya
-
 Lithuania
-
 Luxembourg
-
 Madagascar
-
 Malaysia
-
 Malta
-
 Mauritius
-
 Mexico
-
 Moldova
-
 Mongolia
-
 Montenegro
-
 Morocco
-
 Mozambique
-
 Myanmar
-
 Namibia
-
 Nepal
-
 Netherlands
-
 New Zealand
-
 Nigeria
-
 North Macedonia
-
 Norway
-
 Oman
-
 Pakistan
-
 Palestine
-
 Panama
-
 Papua New Guinea
-
 Paraguay
-
 Peru
-
 Philippines
-
 Poland
-
 Portugal
-
 Puerto Rico
-
 Qatar
-
 Reunion
-
 Romania
-
 Rwanda
-
 Saudi Arabia
-
 Serbia
-
 Singapore
-
 Slovakia
-
 Slovenia
-
 Somalia
-
 South Africa
-
 Spain
-
 Sri Lanka
-
 Sweden
-
 Switzerland
-
 Syria
-
 Taiwan
-
 Tajikistan
-
 Tanzania
-
 Thailand
-
 Trinidad and Tobago
-
 Tunisia
-
 Turkey
-
 UAE
-
 Uganda
-
 Ukraine
-
 United Kingdom
-
United States
-
 Uruguay
-
 Uzbekistan
-
 Venezuela
-
 Vietnam
-
 Yemen
-
 Zambia
-
 Zimbabwe
- Forex
- Crypto












