

BT-A trades flat as consolidation near GBX206.61 support continues

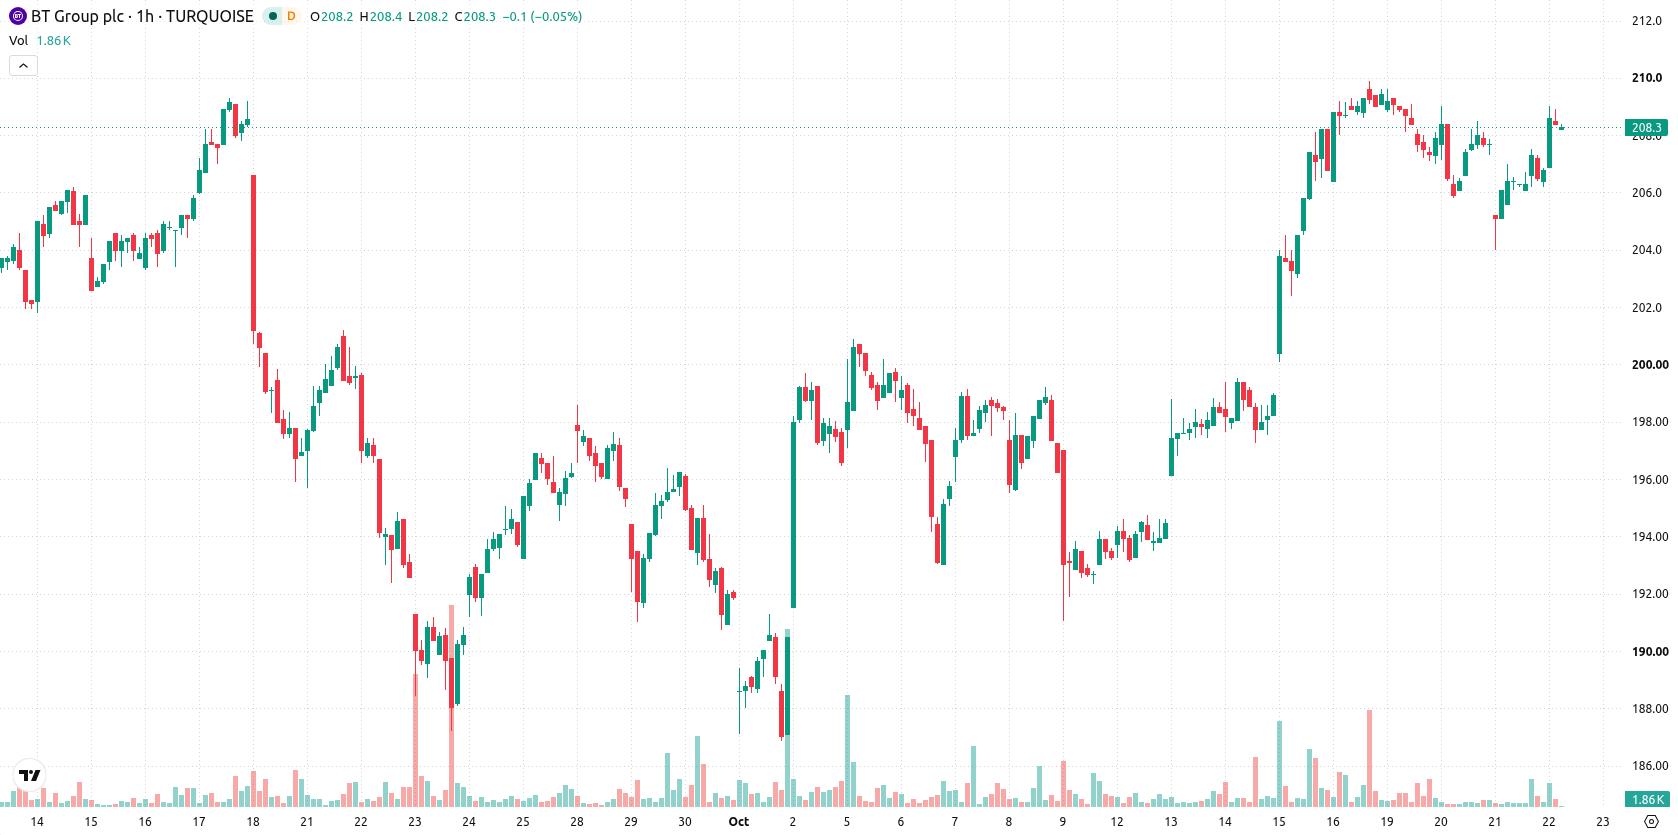
BT Group (BT-A) stock is trading at GBX206.80, edging down slightly on the day. The price sits below its key short-term moving average but remains above medium- and long-term trend levels.
 229.00
Highlights
- BT-A/GBX stock trades below the 20-day moving average but remains above both the 50-day and 200-day averages.
- Technical indicators are mixed, with neutral momentum readings and mild buying interest shown on RSI and Stoch RSI.
- Expected price range for the next few sessions is GBX202.31 to GBX211.29, with an upward move viewed as very likely.
Mixed momentum signals as trend boundaries reinforce volatility
BT-A trades below the MA-20, while remaining above both the MA-50 and the MA-200. The Ichimoku Kijun at GBX206.61 serves as immediate support. Momentum indicators present a mixed picture: MACD and ADX are neutral, with both RSI and Stochastic RSI showing mild buying interest. CCI and the Awesome Oscillator are likewise neutral, and Bull/Bear Power indicates intraday oversold conditions and prevailing seller dominance. Divergences among oscillators and momentum signals, combined with inconclusive intraday price action, reflect moderate volatility.
Consolidation likely as price stays within defined volatility band
Over the next few sessions, price is expected to consolidate within the GBX202.31 to GBX211.29 band, representing the typical volatility range. If BT-A breaks above resistance, the price may accelerate toward the upper end of this range. A breach of support at the Ichimoku Kijun or GBX202.31 would trigger downside risk, though this is currently regarded as very unlikely.
Earlier, analysts noted that BT Group shares were consolidating amid mixed technical signals and awaited a decisive move to clarify the next trend direction. The current article reinforces this outlook, highlighting persistent volatility and oscillator divergences, and suggests that traders should closely monitor for a potential breakout above the established volatility band.






Latest BT Group News



-
 Afghanistan
-
 Albania
-
 Algeria
-
 Angola
-
 Argentina
-
 Armenia
-
 Australia
-
 Austria
-
 Azerbaijan
-
 Bahamas
-
 Bahrain
-
 Bangladesh
-
 Belarus
-
 Belgium
-
 Bolivia
-
 Botswana
-
 Brazil
-
 Brunei
-
 Bulgaria
-
 Cambodia
-
 Cameroon
-
 Canada
-
 Chile
-
 China
-
 Colombia
-
 Congo
-
 Costa Rica
-
 Cote d'Ivoire
-
 Croatia
-
 Cuba
-
 Cyprus
-
 Czechia
-
 DR Congo
-
 Denmark
-
 Dominican Republic
-
 Ecuador
-
 Egypt
-
 El Salvador
-
 Estonia
-
 Eswatini
-
 Ethiopia
-
 Finland
-
 France
-
 Georgia
-
 Germany
-
 Ghana
-
 Greece
-
 Haiti
-
 Hong Kong
-
 Hungary
-
 India
-
 Indonesia
-
 Iran, Islamic republic
-
 Iraq
-
 Ireland
-
 Israel
-
 Italy
-
 Jamaica
-
 Japan
-
 Jordan
-
 Kazakhstan
-
 Kenya
-
 Korea
-
 Kuwait
-
 Kyrgyzstan
-
 Laos
-
 Latvia
-
 Lebanon
-
 Lesotho
-
 Libya
-
 Lithuania
-
 Luxembourg
-
 Madagascar
-
 Malaysia
-
 Malta
-
 Mauritius
-
 Mexico
-
 Moldova
-
 Mongolia
-
 Montenegro
-
 Morocco
-
 Mozambique
-
 Myanmar
-
 Namibia
-
 Nepal
-
 Netherlands
-
 New Zealand
-
 Nigeria
-
 North Macedonia
-
 Norway
-
 Oman
-
 Pakistan
-
 Palestine
-
 Panama
-
 Papua New Guinea
-
 Paraguay
-
 Peru
-
 Philippines
-
 Poland
-
 Portugal
-
 Puerto Rico
-
 Qatar
-
 Reunion
-
 Romania
-
 Rwanda
-
 Saudi Arabia
-
 Serbia
-
 Singapore
-
 Slovakia
-
 Slovenia
-
 Somalia
-
 South Africa
-
 Spain
-
 Sri Lanka
-
 Sweden
-
 Switzerland
-
 Syria
-
 Taiwan
-
 Tajikistan
-
 Tanzania
-
 Thailand
-
 Trinidad and Tobago
-
 Tunisia
-
 Turkey
-
 UAE
-
 Uganda
-
 Ukraine
-
 United Kingdom
-
United States
-
 Uruguay
-
 Uzbekistan
-
 Venezuela
-
 Vietnam
-
 Yemen
-
 Zambia
-
 Zimbabwe
- Forex
- Crypto












