


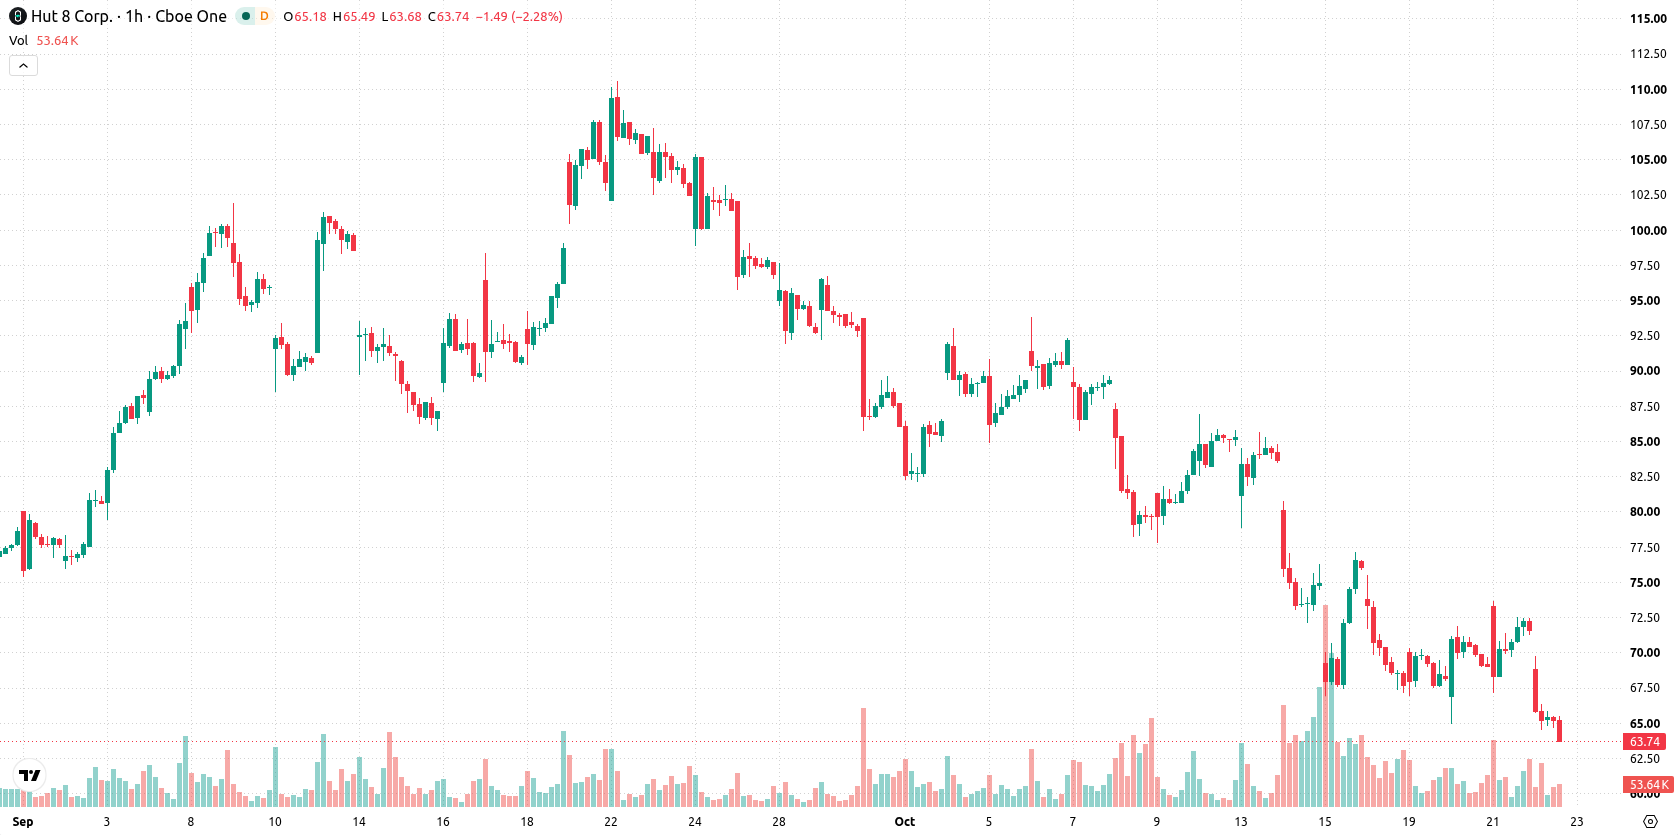
Hut 8 (HUT) stock is trading at $64.09 after a daily decline of 10.46%. The price currently sits below its key moving averages, indicating ongoing downward momentum.
 61.98
69.73
Highlights
- HUT/USD trades below major moving averages across all timeframes, showing persistent seller control in short-, medium-, and long-term trends.
- Momentum and oscillator indicators all register strong sell or oversold conditions, although technicals display a risk of a short-term corrective bounce.
- Price dropped 10.46% to $64.09 with high volatility, projecting a range of $58.72 to $68.57 and a 74% probability of further downside.
Multiple indicators signal selling as price approaches oversold zone
On the hourly chart, HUT is trading below the MA-20 at $69.31 and MA-50 at $71.95, with price action also below the daily MA-200 at $82.33. The Ichimoku Kijun level at $69.06 serves as immediate resistance. Momentum indicators continue to show bearish pressure as both MACD and ADX register sell signals. RSI is at 35.66 and suggests oversold conditions, with Stochastic RSI, CCI, and Bull/Bear Power also highlighting strong seller dominance intraday. The Awesome Oscillator remains neutral, offering no clear directional bias. A wide gap down at the open and high volatility underline the session’s weakness, while the cluster of oversold signals introduces potential for a near-term technical bounce despite prevailing downside momentum.
Downside viewed as likely amid resistance and volatility
Over the next 2-3 trading days, HUT is expected to trade within the $58.72 to $68.57 range as typical volatility. The probability of a further decline remains high at 74%, making additional downside statistically more likely. However, if a short-term bounce occurs, a move above immediate resistance and the Kijun level at $69.06 would be needed to shift the scenario toward recovery. A break below support at $58.72 could trigger renewed selling and extend the current downtrend.
Earlier, analysts noted that Hut 8’s technical outlook was pressured by mixed momentum, with downside risks outweighing immediate breakout potential. The latest deterioration in both price and indicators reinforces this bearish scenario, making a decisive move above $69.06 resistance the key signal for any potential shift toward recovery.











-
 Afghanistan
-
 Albania
-
 Algeria
-
 Angola
-
 Argentina
-
 Armenia
-
 Australia
-
 Austria
-
 Azerbaijan
-
 Bahamas
-
 Bahrain
-
 Bangladesh
-
 Belarus
-
 Belgium
-
 Bolivia
-
 Botswana
-
 Brazil
-
 Brunei
-
 Bulgaria
-
 Cambodia
-
 Cameroon
-
 Canada
-
 Chile
-
 China
-
 Colombia
-
 Congo
-
 Costa Rica
-
 Cote d'Ivoire
-
 Croatia
-
 Cuba
-
 Cyprus
-
 Czechia
-
 DR Congo
-
 Denmark
-
 Dominican Republic
-
 Ecuador
-
 Egypt
-
 El Salvador
-
 Estonia
-
 Eswatini
-
 Ethiopia
-
 Finland
-
 France
-
 Georgia
-
 Germany
-
 Ghana
-
 Greece
-
 Haiti
-
 Hong Kong
-
 Hungary
-
 India
-
 Indonesia
-
 Iran, Islamic republic
-
 Iraq
-
 Ireland
-
 Israel
-
 Italy
-
 Jamaica
-
 Japan
-
 Jordan
-
 Kazakhstan
-
 Kenya
-
 Korea
-
 Kuwait
-
 Kyrgyzstan
-
 Laos
-
 Latvia
-
 Lebanon
-
 Lesotho
-
 Libya
-
 Lithuania
-
 Luxembourg
-
 Madagascar
-
 Malaysia
-
 Malta
-
 Mauritius
-
 Mexico
-
 Moldova
-
 Mongolia
-
 Montenegro
-
 Morocco
-
 Mozambique
-
 Myanmar
-
 Namibia
-
 Nepal
-
 Netherlands
-
 New Zealand
-
 Nigeria
-
 North Macedonia
-
 Norway
-
 Oman
-
 Pakistan
-
 Palestine
-
 Panama
-
 Papua New Guinea
-
 Paraguay
-
 Peru
-
 Philippines
-
 Poland
-
 Portugal
-
 Puerto Rico
-
 Qatar
-
 Reunion
-
 Romania
-
 Rwanda
-
 Saudi Arabia
-
 Serbia
-
 Singapore
-
 Slovakia
-
 Slovenia
-
 Somalia
-
 South Africa
-
 Spain
-
 Sri Lanka
-
 Sweden
-
 Switzerland
-
 Syria
-
 Taiwan
-
 Tajikistan
-
 Tanzania
-
 Thailand
-
 Trinidad and Tobago
-
 Tunisia
-
 Turkey
-
 UAE
-
 Uganda
-
 Ukraine
-
 United Kingdom
-
United States
-
 Uruguay
-
 Uzbekistan
-
 Venezuela
-
 Vietnam
-
 Yemen
-
 Zambia
-
 Zimbabwe
- Forex
- Crypto












