

BT Group shares technical analysis: Uptrend may pause near GBX215.89 resistance

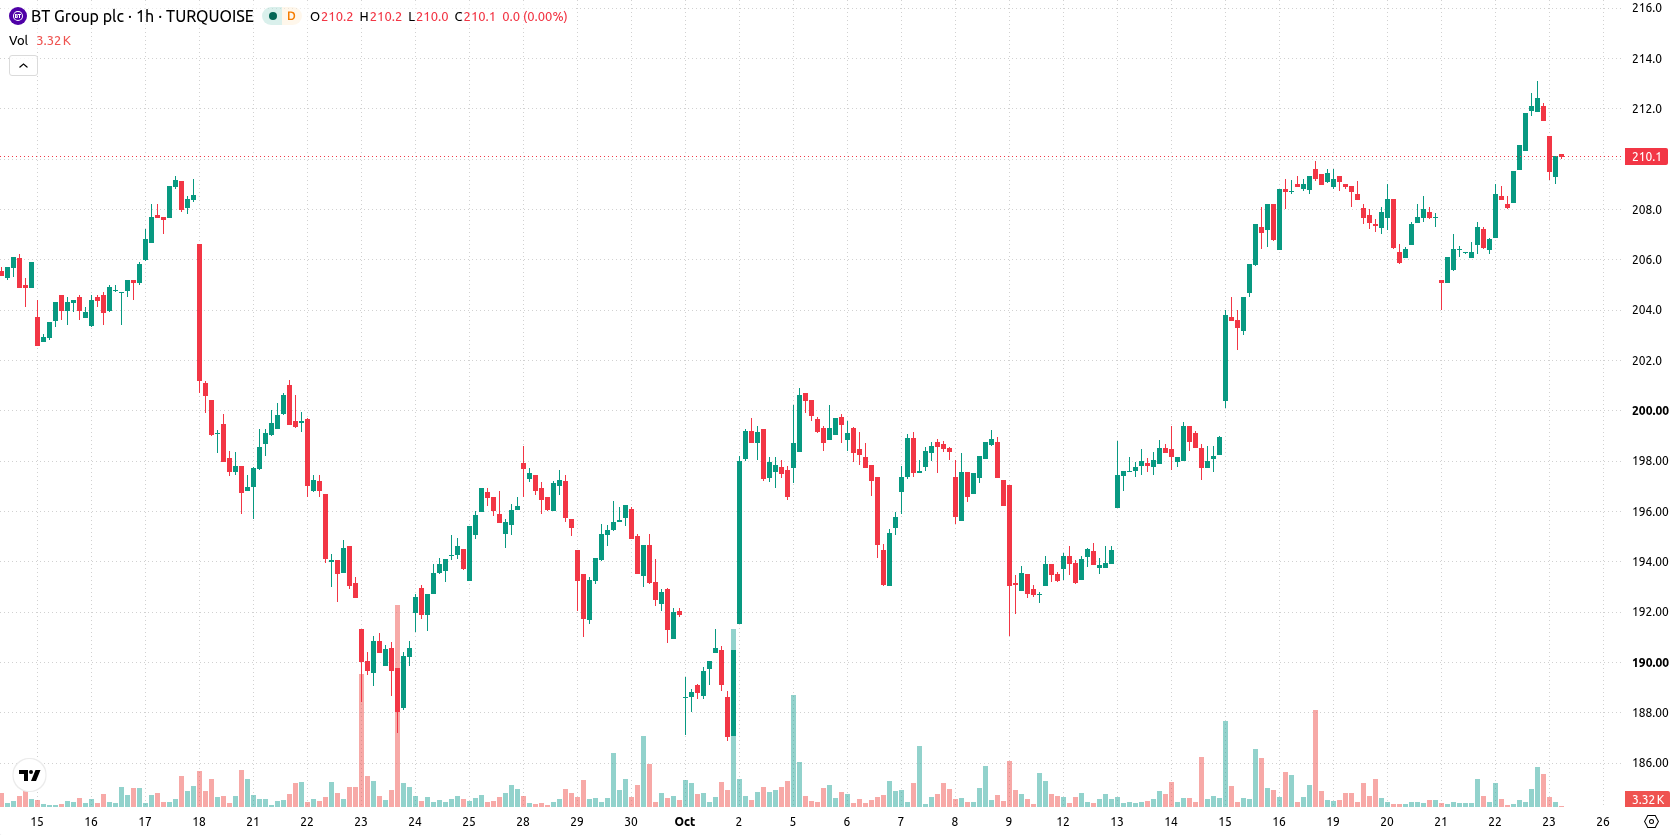
BT Group (BT-A) stock is trading at GBX211.7, gaining 2.47% on the day. The price sits above its key short- and long-term moving averages, reflecting ongoing upward momentum.
 214.40
Highlights
- Shares of BT Group gained 2.47% today, closing near the session high and posting a 0.4 gap up on moderate volatility.
- The stock trades above key short and long-term moving averages, with strong short-term momentum signals but several indicators warn of overbought conditions.
- Expected price range for the next few days is GBX207.51 to GBX215.89, with a 74% probability of continued upward movement and support at GBX208.51.
Overbought signals emerge as bullish momentum persists
On the technical front, BT-A has established support at the Ichimoku Kijun level of GBX208.51, with short-term MA-20 at GBX208.26, MA-50 at GBX208.14, and the long-term MA-200 at GBX203.72 all sitting below the current price. MACD remains on a Buy signal, while the Awesome Oscillator confirms positive momentum. However, RSI stands at 68.61, and both Stochastic RSI and CCI are overbought, highlighting the risk of exhaustion. Bull/Bear Power signals buyers are in control intraday, but ADX is Neutral, indicating the trend lacks firm establishment. There is a mild divergence as overbought signals begin to warn of potential consolidation despite strong upward momentum.
Consolidation risk rises as price approaches resistance
Looking ahead, BT-A is likely to consolidate in the short term, with a typical volatility range expected between GBX207.51 and GBX215.89 for the next few days. There is a 74% probability of continued gains within this corridor, while the chance of a reversal lower stands at 26%. A decisive move above resistance could open the path to new highs; a drop below key support would suggest a retracement or period of price correction.
Earlier, analysts noted that BT Group's recent acquisition activity was shifting focus onto market structure changes and potential impacts on sector dynamics. The current technical setup, while highlighting near-term consolidation risks, suggests traders should closely monitor the GBX208.51 support level, as a sustained move below this threshold could trigger a deeper correction.








-
 Afghanistan
-
 Albania
-
 Algeria
-
 Angola
-
 Argentina
-
 Armenia
-
 Australia
-
 Austria
-
 Azerbaijan
-
 Bahamas
-
 Bahrain
-
 Bangladesh
-
 Belarus
-
 Belgium
-
 Bolivia
-
 Botswana
-
 Brazil
-
 Brunei
-
 Bulgaria
-
 Cambodia
-
 Cameroon
-
 Canada
-
 Chile
-
 China
-
 Colombia
-
 Congo
-
 Costa Rica
-
 Cote d'Ivoire
-
 Croatia
-
 Cuba
-
 Cyprus
-
 Czechia
-
 DR Congo
-
 Denmark
-
 Dominican Republic
-
 Ecuador
-
 Egypt
-
 El Salvador
-
 Estonia
-
 Eswatini
-
 Ethiopia
-
 Finland
-
 France
-
 Georgia
-
 Germany
-
 Ghana
-
 Greece
-
 Haiti
-
 Hong Kong
-
 Hungary
-
 India
-
 Indonesia
-
 Iran, Islamic republic
-
 Iraq
-
 Ireland
-
 Israel
-
 Italy
-
 Jamaica
-
 Japan
-
 Jordan
-
 Kazakhstan
-
 Kenya
-
 Korea
-
 Kuwait
-
 Kyrgyzstan
-
 Laos
-
 Latvia
-
 Lebanon
-
 Lesotho
-
 Libya
-
 Lithuania
-
 Luxembourg
-
 Madagascar
-
 Malaysia
-
 Malta
-
 Mauritius
-
 Mexico
-
 Moldova
-
 Mongolia
-
 Montenegro
-
 Morocco
-
 Mozambique
-
 Myanmar
-
 Namibia
-
 Nepal
-
 Netherlands
-
 New Zealand
-
 Nigeria
-
 North Macedonia
-
 Norway
-
 Oman
-
 Pakistan
-
 Palestine
-
 Panama
-
 Papua New Guinea
-
 Paraguay
-
 Peru
-
 Philippines
-
 Poland
-
 Portugal
-
 Puerto Rico
-
 Qatar
-
 Reunion
-
 Romania
-
 Rwanda
-
 Saudi Arabia
-
 Serbia
-
 Singapore
-
 Slovakia
-
 Slovenia
-
 Somalia
-
 South Africa
-
 Spain
-
 Sri Lanka
-
 Sweden
-
 Switzerland
-
 Syria
-
 Taiwan
-
 Tajikistan
-
 Tanzania
-
 Thailand
-
 Trinidad and Tobago
-
 Tunisia
-
 Turkey
-
 UAE
-
 Uganda
-
 Ukraine
-
 United Kingdom
-
United States
-
 Uruguay
-
 Uzbekistan
-
 Venezuela
-
 Vietnam
-
 Yemen
-
 Zambia
-
 Zimbabwe
- Forex
- Crypto












