

TELUS stock falls around 1.5% as dividend cut by 55% adds selling pressure

TELUS Corporation (T) extended its decline by 1.54% after the company slashed its dividend by 55% in a bid to reduce debt and restructure finances. The drop is reinforced by the technical setup, with TELUS trading above the 20-day average but still below key 50- and 200-day moving averages, which points to ongoing medium- and long-term selling pressure.
 12.41
12.41
Highlights
- TELUS cut its quarterly dividend by 55% to C$0.19 per share for Q2 2026 to prioritize debt reduction and lower leverage by 2028.
- TELUS continues to generate positive free cash flow, invest in digital infrastructure, and pursue operational restructuring for scalability.
- Shares of TELUS trade in a consolidated range of C$11.74 to C$12.60, with technical signals showing overbought conditions clashing with ongoing selling pressure.
Dividend reduction and reinvestment as debt reduction strategy meets weak sentiment
TELUS reduced its quarterly dividend by 55% to C$0.19 per share for the second quarter of 2026, aiming to prioritize debt reduction and lower its leverage ratio by the end of 2028. The company is continuing to generate positive free cash flow and investing in digital infrastructure, healthcare technology, and operational restructuring for improved efficiency and scalability. TELUS also launched a Norton scam protection service within its mobility plans to support cross-selling and higher-margin offerings, though price action has remained under broader selling pressure.
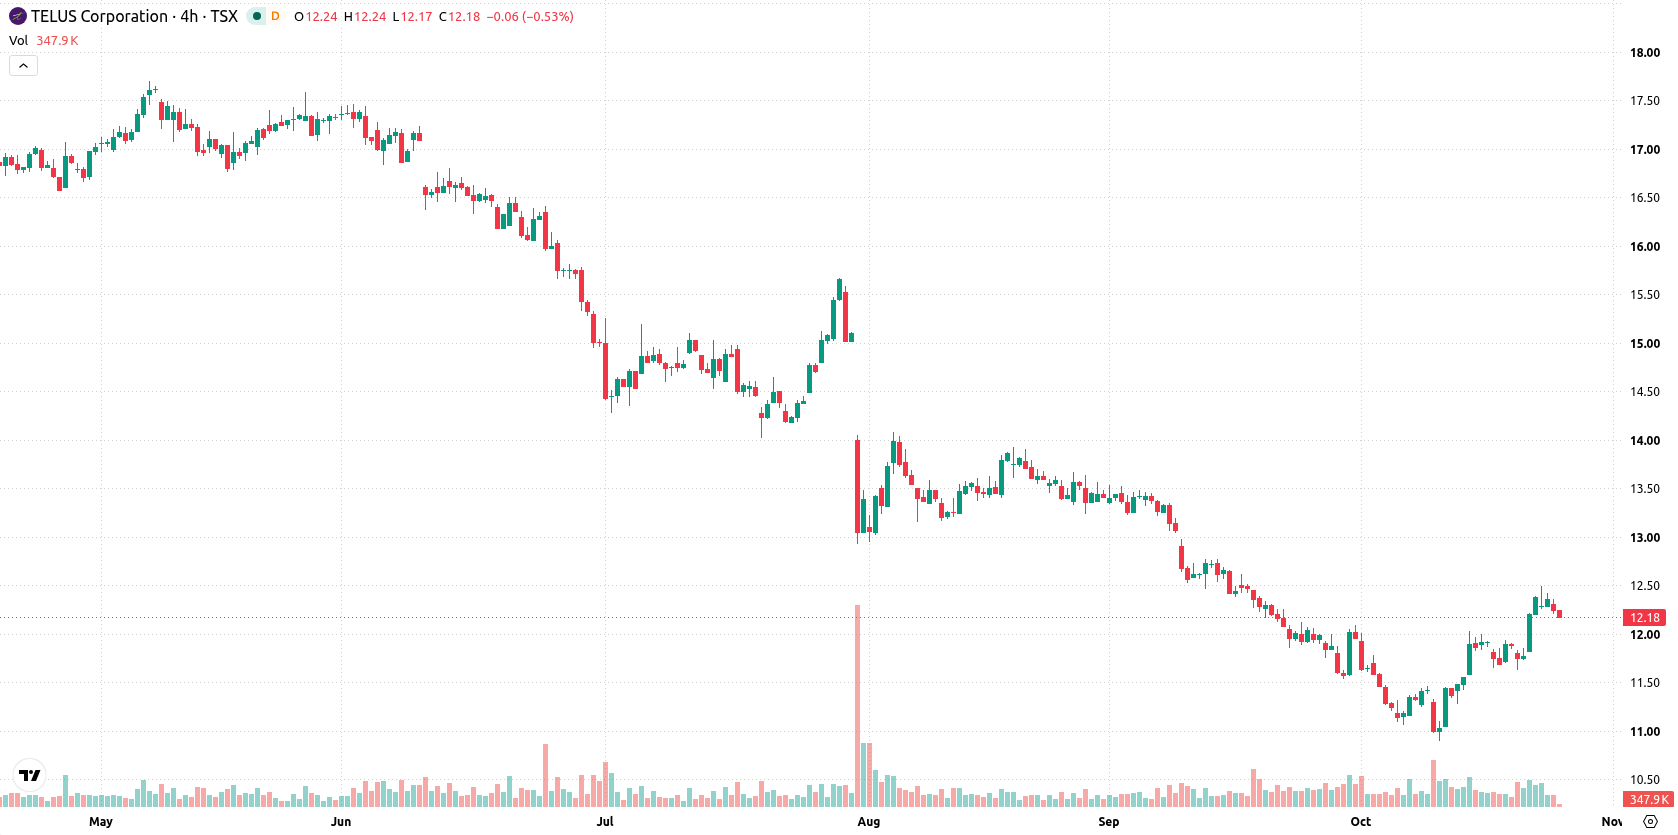
Overbought signals clash with selling trend as resistance limits gains
TELUS is trading above its 20-day moving average (C$11.67) but remains below both the 50-day (C$12.51) and 200-day (C$15.92) moving averages, indicating short-term strength but ongoing medium- and long-term pressure from sellers. The Ichimoku Kijun line at C$11.75 offers near-term floor support, with resistance at the near-term ceiling of C$12.25. The overall alignment of the 50- and 200-day averages stays bearish. Momentum readings are mixed: the MACD signals strong selling momentum, the ADX suggests trend strength, and the RSI points to a buy setup. Both Stochastic RSI and CCI show overbought conditions, while Bull/Bear Power reveals buyers dominate intraday momentum with an overbought bias. Intraday volatility is 0.90%, and the stock currently sits closer to the session low following a downside gap at the open. Divergent oscillator signals suggest overbought momentum is clashing with persistent selling pressure.
Earlier, analysts noted that Telus stock was consolidating as technical indicators signaled a broadly neutral to modestly bullish short-term outlook despite longer-term resistance. The latest developments, including the dividend cut and reinforced downside technical signals, introduce additional downside risk, making a decisive break below C$11.75 a critical level to watch for further weakness in the coming sessions.










-
 Afghanistan
-
 Albania
-
 Algeria
-
 Angola
-
 Argentina
-
 Armenia
-
 Australia
-
 Austria
-
 Azerbaijan
-
 Bahamas
-
 Bahrain
-
 Bangladesh
-
 Belarus
-
 Belgium
-
 Bolivia
-
 Botswana
-
 Brazil
-
 Brunei
-
 Bulgaria
-
 Cambodia
-
 Cameroon
-
 Canada
-
 Chile
-
 China
-
 Colombia
-
 Congo
-
 Costa Rica
-
 Cote d'Ivoire
-
 Croatia
-
 Cuba
-
 Cyprus
-
 Czechia
-
 DR Congo
-
 Denmark
-
 Dominican Republic
-
 Ecuador
-
 Egypt
-
 El Salvador
-
 Estonia
-
 Eswatini
-
 Ethiopia
-
 Finland
-
 France
-
 Georgia
-
 Germany
-
 Ghana
-
 Greece
-
 Haiti
-
 Hong Kong
-
 Hungary
-
 India
-
 Indonesia
-
 Iran, Islamic republic
-
 Iraq
-
 Ireland
-
 Israel
-
 Italy
-
 Jamaica
-
 Japan
-
 Jordan
-
 Kazakhstan
-
 Kenya
-
 Korea
-
 Kuwait
-
 Kyrgyzstan
-
 Laos
-
 Latvia
-
 Lebanon
-
 Lesotho
-
 Libya
-
 Lithuania
-
 Luxembourg
-
 Madagascar
-
 Malaysia
-
 Malta
-
 Mauritius
-
 Mexico
-
 Moldova
-
 Mongolia
-
 Montenegro
-
 Morocco
-
 Mozambique
-
 Myanmar
-
 Namibia
-
 Nepal
-
 Netherlands
-
 New Zealand
-
 Nigeria
-
 North Macedonia
-
 Norway
-
 Oman
-
 Pakistan
-
 Palestine
-
 Panama
-
 Papua New Guinea
-
 Paraguay
-
 Peru
-
 Philippines
-
 Poland
-
 Portugal
-
 Puerto Rico
-
 Qatar
-
 Reunion
-
 Romania
-
 Rwanda
-
 Saudi Arabia
-
 Serbia
-
 Singapore
-
 Slovakia
-
 Slovenia
-
 Somalia
-
 South Africa
-
 Spain
-
 Sri Lanka
-
 Sweden
-
 Switzerland
-
 Syria
-
 Taiwan
-
 Tajikistan
-
 Tanzania
-
 Thailand
-
 Trinidad and Tobago
-
 Tunisia
-
 Turkey
-
 UAE
-
 Uganda
-
 Ukraine
-
 United Kingdom
-
United States
-
 Uruguay
-
 Uzbekistan
-
 Venezuela
-
 Vietnam
-
 Yemen
-
 Zambia
-
 Zimbabwe
- Forex
- Crypto












