

Canadian Pacific Kansas City stock consolidates near C$126.16 as overbought conditions emerge

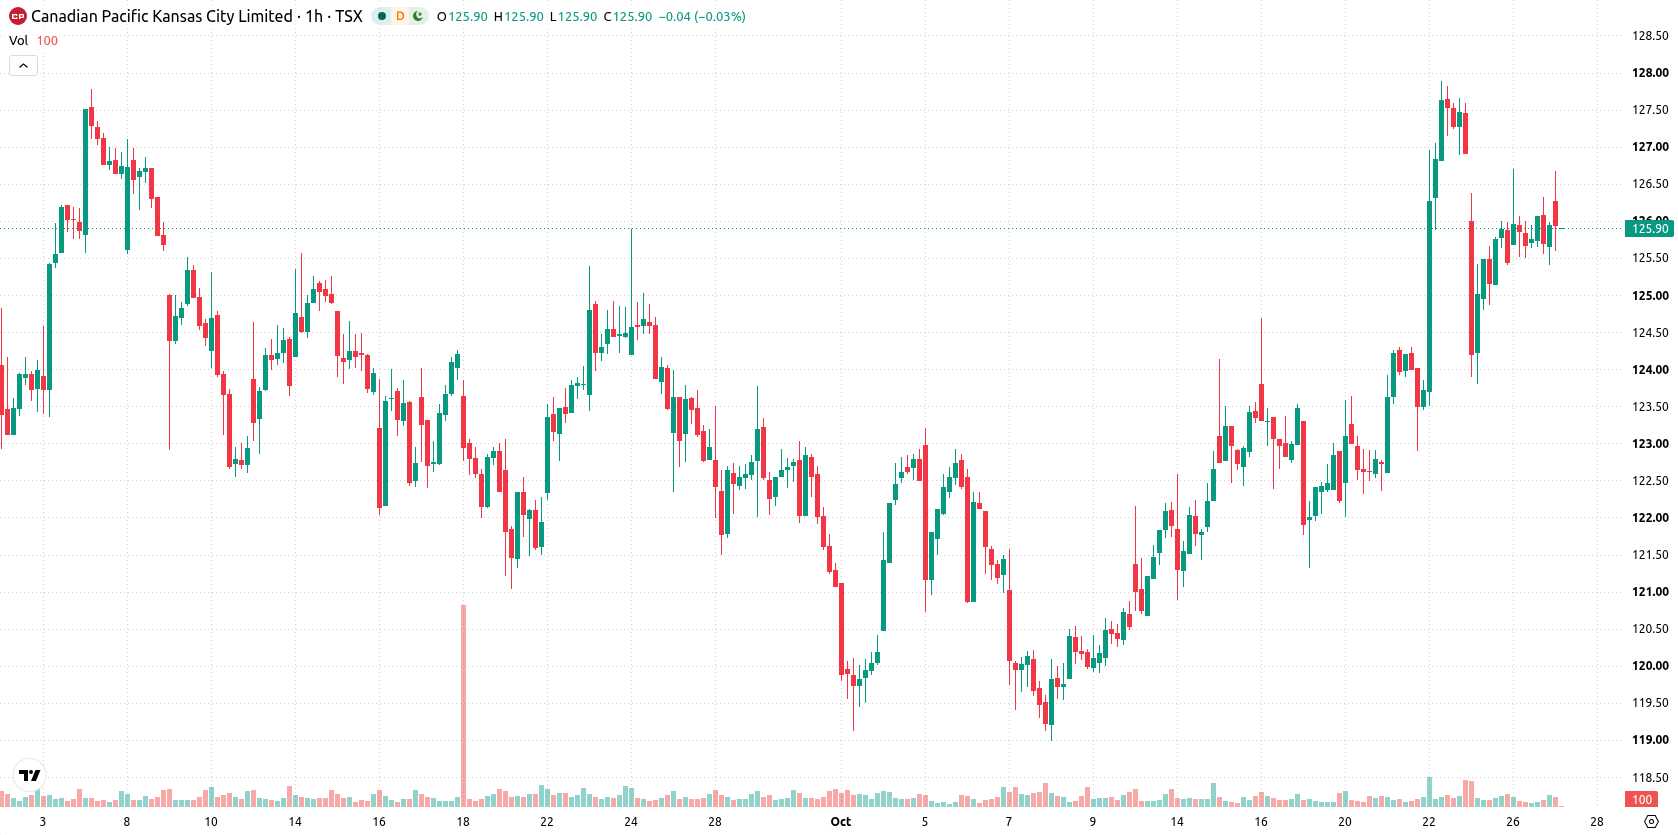
Canadian Pacific Kansas City (CP) stock is trading at C$126.16, posting a modest daily gain. The price is positioned above its key moving averages, reflecting stable momentum within a low-volatility environment.
 128.26
Highlights
- CP/CAD remains in a bullish configuration, trading above key moving averages on hourly and daily timeframes.
- Momentum indicators such as MACD indicate strong buy conditions, but overbought oscillators and neutral trend signals suggest mixed short-term signals.
- CP/CAD is projected to trade between C$123.96 and C$128.36 in coming sessions, with a 70% probability of an upward move.
Mixed momentum as oscillators diverge and buyer control persists
On the technical side, CP is trading above the MA-20 at C$126.08 and the MA-50 at C$124.32 on the hourly chart, and remains well above the MA-200 at C$118.86 on the daily timeframe. The Ichimoku Kijun at C$125.4 provides nearby support, with the expected short-term range defined by support at C$123.96 and resistance at C$128.36. MACD reflects a strong buy signal, while ADX remains neutral and Awesome Oscillator yields no clear direction. RSI stands at 55.17, suggesting mild buying activity, whereas Stoch RSI registers as overbought and CCI is neutral, highlighting mixed oscillator signals. Bull/Bear Power points to intraday buyer control.
Range-bound outlook as overbought signals temper upside
In the coming sessions, CP is expected to remain range-bound between C$123.96 and C$128.36, with volatility likely subdued in the near term. There is a 70% probability of an upward move, though caution is warranted due to overbought short-term oscillators. A breakout above resistance could invite renewed momentum, while a drop below immediate support may see prices test lower boundaries within the established band.
Earlier, analysts noted that Canadian Pacific Kansas City shares were likely to remain in a consolidation phase, with technical signals supporting a largely range-bound outlook. The latest data reinforce this view, suggesting that traders should monitor the evolving technical setup for a potential breakout or breakdown from the current volatility band.










-
 Afghanistan
-
 Albania
-
 Algeria
-
 Angola
-
 Argentina
-
 Armenia
-
 Australia
-
 Austria
-
 Azerbaijan
-
 Bahamas
-
 Bahrain
-
 Bangladesh
-
 Belarus
-
 Belgium
-
 Bolivia
-
 Botswana
-
 Brazil
-
 Brunei
-
 Bulgaria
-
 Cambodia
-
 Cameroon
-
 Canada
-
 Chile
-
 China
-
 Colombia
-
 Congo
-
 Costa Rica
-
 Cote d'Ivoire
-
 Croatia
-
 Cuba
-
 Cyprus
-
 Czechia
-
 DR Congo
-
 Denmark
-
 Dominican Republic
-
 Ecuador
-
 Egypt
-
 El Salvador
-
 Estonia
-
 Eswatini
-
 Ethiopia
-
 Finland
-
 France
-
 Georgia
-
 Germany
-
 Ghana
-
 Greece
-
 Haiti
-
 Hong Kong
-
 Hungary
-
 India
-
 Indonesia
-
 Iran, Islamic republic
-
 Iraq
-
 Ireland
-
 Israel
-
 Italy
-
 Jamaica
-
 Japan
-
 Jordan
-
 Kazakhstan
-
 Kenya
-
 Korea
-
 Kuwait
-
 Kyrgyzstan
-
 Laos
-
 Latvia
-
 Lebanon
-
 Lesotho
-
 Libya
-
 Lithuania
-
 Luxembourg
-
 Madagascar
-
 Malaysia
-
 Malta
-
 Mauritius
-
 Mexico
-
 Moldova
-
 Mongolia
-
 Montenegro
-
 Morocco
-
 Mozambique
-
 Myanmar
-
 Namibia
-
 Nepal
-
 Netherlands
-
 New Zealand
-
 Nigeria
-
 North Macedonia
-
 Norway
-
 Oman
-
 Pakistan
-
 Palestine
-
 Panama
-
 Papua New Guinea
-
 Paraguay
-
 Peru
-
 Philippines
-
 Poland
-
 Portugal
-
 Puerto Rico
-
 Qatar
-
 Reunion
-
 Romania
-
 Rwanda
-
 Saudi Arabia
-
 Serbia
-
 Singapore
-
 Slovakia
-
 Slovenia
-
 Somalia
-
 South Africa
-
 Spain
-
 Sri Lanka
-
 Sweden
-
 Switzerland
-
 Syria
-
 Taiwan
-
 Tajikistan
-
 Tanzania
-
 Thailand
-
 Trinidad and Tobago
-
 Tunisia
-
 Turkey
-
 UAE
-
 Uganda
-
 Ukraine
-
 United Kingdom
-
United States
-
 Uruguay
-
 Uzbekistan
-
 Venezuela
-
 Vietnam
-
 Yemen
-
 Zambia
-
 Zimbabwe
- Forex
- Crypto












