

Can T hold above C$12.06 support amid subdued trading and neutral technical momentum?

TELUS (T) stock is trading at C$12.11 after a modest decline today. The price is currently positioned below its key short-term moving averages, with low volatility and subdued intraday movement.
 12.07
12.49
Highlights
- TELUS Digital received Leader and Star Performer status from Everest Group for its AI-driven trust and safety solutions.
- The industry recognition may support modest improvements in institutional and client confidence during stable market periods.
- Shares of TELUS traded at C$12.11 after falling 0.74% today, with technical indicators mixed and a 59% probability of remaining between C$11.73 and C$12.49 in the coming days.
Industry leadership recognition lifts reputation amid subdued investor response
TELUS Digital was recognized as a Leader and Star Performer in Everest Group's 2026 Trust and Safety Services PEAK Matrix Assessment for its AI-powered digital customer experience and platform integrity solutions, according to PR Newswire. This acknowledgment reflects an elevated standing among industry peers in trust, safety, and technology-driven customer service. The recognition may encourage institutional and client confidence, though such reputational gains typically result in only incremental shifts in investor sentiment during periods of quieter trading.
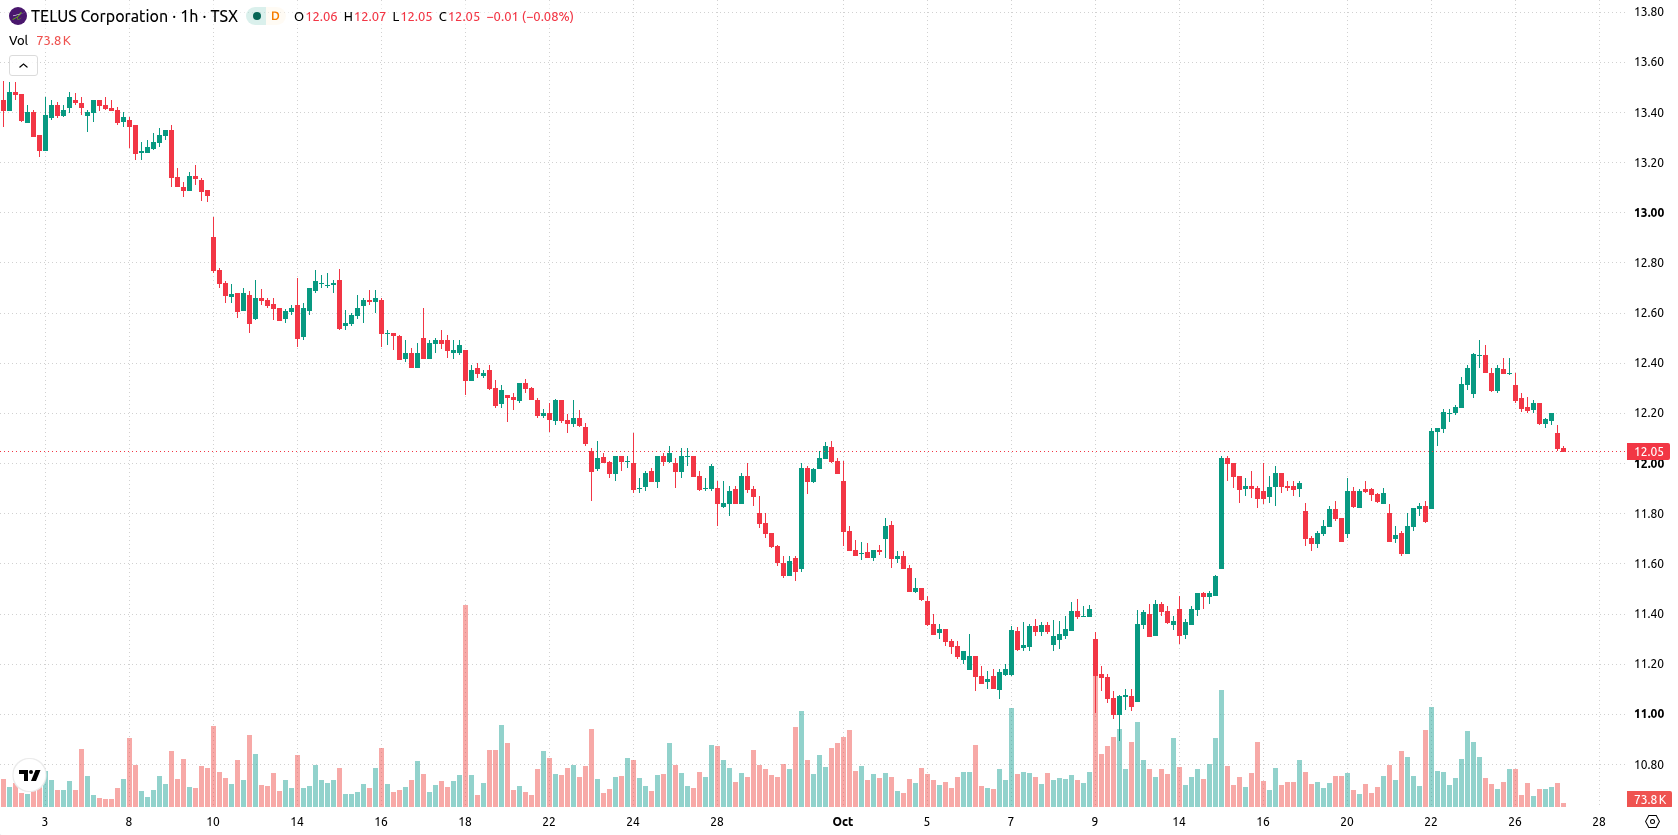
Mixed momentum with seller bias as price straddles key support levels
On the hourly chart, T is positioned below the MA-20 but above the MA-50, while on the daily timeframe, price remains well below the MA-200. The Ichimoku Kijun at C$12.06 is serving as the nearest support. Among momentum indicators, MACD signals Strong Buy and ADX is in Buy mode, contrasted by a modestly bullish RSI at 52.43. Stoch RSI is oversold, whereas both CCI and Bull/Bear Power point toward ongoing seller dominance. The Awesome Oscillator remains neutral, underscoring market indecision within a low-volatility range.
Sideways movement likely barring breakout in low-volatility range
For the coming days, T is likely to oscillate within the C$11.73 to C$12.49 corridor, a typical volatility band relative to current levels. The forecast suggests a 59% probability of an upward move, with a 41% chance of a pullback. The baseline scenario assumes the stock moves sideways within this range; if bullish momentum prevails, price could test resistance at C$12.49. A break below the C$12.06 support would raise the risk of a move toward the projected lower bound.
Earlier, analysts noted that persistent technical and fundamental headwinds were driving sustained downside risk for TELUS particularly following the company's significant dividend reduction. The latest technical data confirm ongoing consolidation within a narrow range, and traders should monitor for any decisive breakout beyond C$12.49 resistance or a breakdown below C$12.06 support as indicators of the next directional move.










-
 Afghanistan
-
 Albania
-
 Algeria
-
 Angola
-
 Argentina
-
 Armenia
-
 Australia
-
 Austria
-
 Azerbaijan
-
 Bahamas
-
 Bahrain
-
 Bangladesh
-
 Belarus
-
 Belgium
-
 Bolivia
-
 Botswana
-
 Brazil
-
 Brunei
-
 Bulgaria
-
 Cambodia
-
 Cameroon
-
 Canada
-
 Chile
-
 China
-
 Colombia
-
 Congo
-
 Costa Rica
-
 Cote d'Ivoire
-
 Croatia
-
 Cuba
-
 Cyprus
-
 Czechia
-
 DR Congo
-
 Denmark
-
 Dominican Republic
-
 Ecuador
-
 Egypt
-
 El Salvador
-
 Estonia
-
 Eswatini
-
 Ethiopia
-
 Finland
-
 France
-
 Georgia
-
 Germany
-
 Ghana
-
 Greece
-
 Haiti
-
 Hong Kong
-
 Hungary
-
 India
-
 Indonesia
-
 Iran, Islamic republic
-
 Iraq
-
 Ireland
-
 Israel
-
 Italy
-
 Jamaica
-
 Japan
-
 Jordan
-
 Kazakhstan
-
 Kenya
-
 Korea
-
 Kuwait
-
 Kyrgyzstan
-
 Laos
-
 Latvia
-
 Lebanon
-
 Lesotho
-
 Libya
-
 Lithuania
-
 Luxembourg
-
 Madagascar
-
 Malaysia
-
 Malta
-
 Mauritius
-
 Mexico
-
 Moldova
-
 Mongolia
-
 Montenegro
-
 Morocco
-
 Mozambique
-
 Myanmar
-
 Namibia
-
 Nepal
-
 Netherlands
-
 New Zealand
-
 Nigeria
-
 North Macedonia
-
 Norway
-
 Oman
-
 Pakistan
-
 Palestine
-
 Panama
-
 Papua New Guinea
-
 Paraguay
-
 Peru
-
 Philippines
-
 Poland
-
 Portugal
-
 Puerto Rico
-
 Qatar
-
 Reunion
-
 Romania
-
 Rwanda
-
 Saudi Arabia
-
 Serbia
-
 Singapore
-
 Slovakia
-
 Slovenia
-
 Somalia
-
 South Africa
-
 Spain
-
 Sri Lanka
-
 Sweden
-
 Switzerland
-
 Syria
-
 Taiwan
-
 Tajikistan
-
 Tanzania
-
 Thailand
-
 Trinidad and Tobago
-
 Tunisia
-
 Turkey
-
 UAE
-
 Uganda
-
 Ukraine
-
 United Kingdom
-
United States
-
 Uruguay
-
 Uzbekistan
-
 Venezuela
-
 Vietnam
-
 Yemen
-
 Zambia
-
 Zimbabwe
- Forex
- Crypto












