

Reckitt Benckiser shares technical analysis: GBX5,353 resistance in focus after recent rebound

Reckitt Benckiser (RKT) stock is trading at GBX5,272, up 1.03% on the day. The price remains below short- and medium-term averages but above longer-term support levels.
 5450.00
5568.00
Highlights
- Reckitt Benckiser reported 3.3% like-for-like net revenue growth in its Core Reckitt segment for the third quarter of 2026.
- The company lowered full-year 2026 revenue growth guidance due to temporary Lysol manufacturing constraints in North America and weaker supplement demand in China.
- Shares of Reckitt Benckiser face seller pressure below key moving averages with short-term indecision, and the expected trading range is GBX5,020 to GBX5,523.
Revenue outlook lowered as operational bottlenecks trigger market repricing
Reckitt Benckiser Group PLC delivered like-for-like net revenue growth of 3.3% in its Core Reckitt business for the third quarter of 2026, driven by improved sales in Emerging Markets and a recovery in Europe. However, the company reduced its full-year 2026 like-for-like revenue growth guidance, citing temporary manufacturing constraints for Lysol in North America and weaker demand in China's supplements market, according to Yahoo Finance. The guidance revision led to a notable share price reaction, as reported by Proactiveinvestors, reflecting market sensitivity to updated outlooks and operational headwinds.
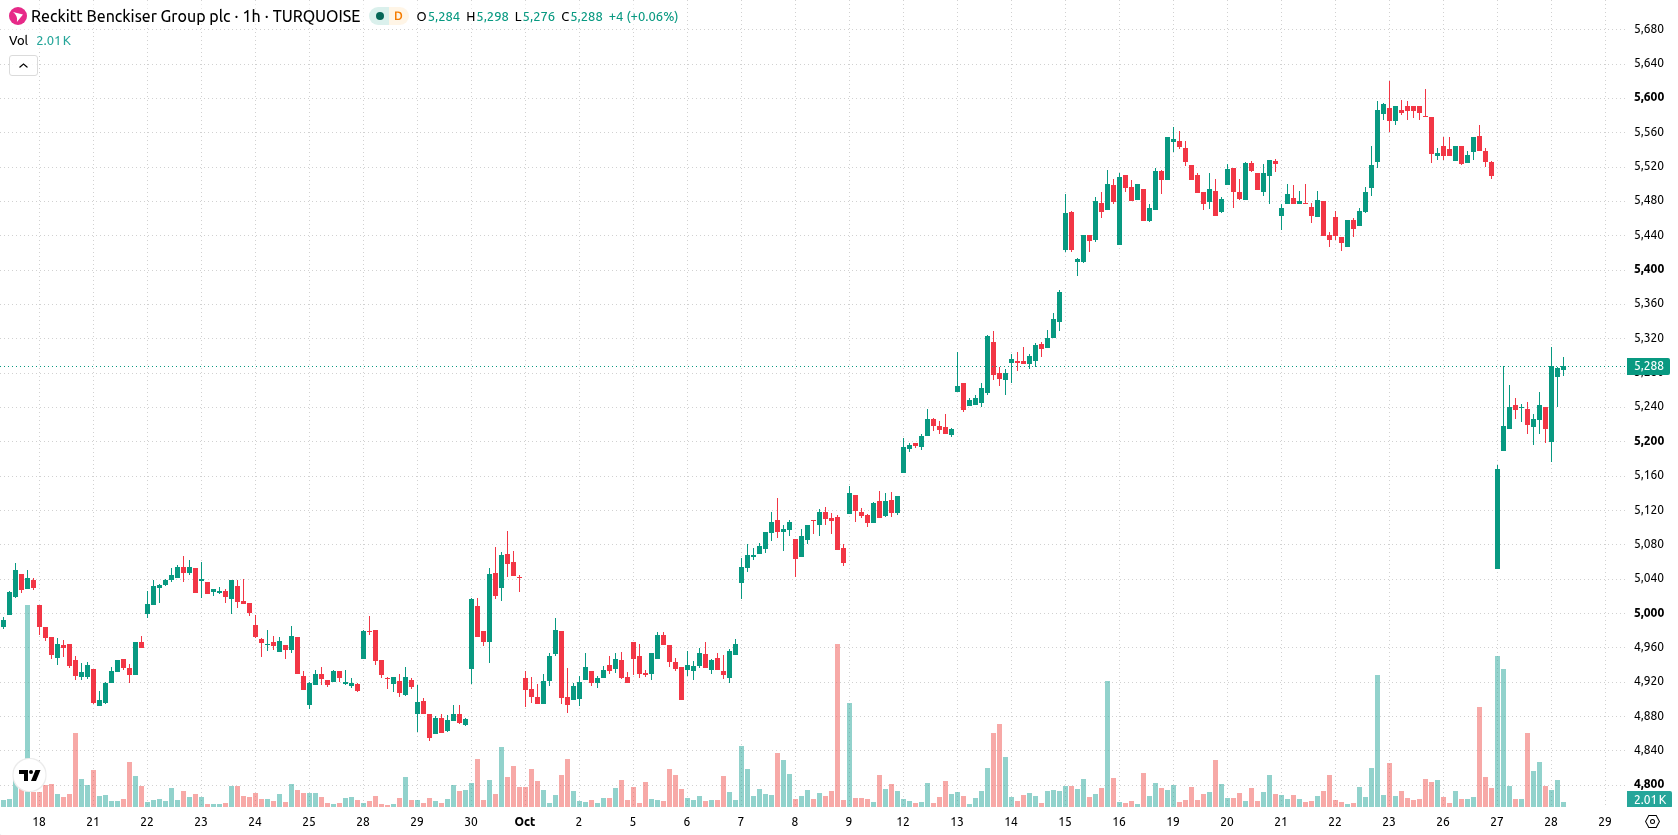
Upside constrained at resistance amid fading momentum and oversold signals
RKT/GBX is encountering resistance at the Ichimoku Kijun level of GBX5,353, while remaining under both the MA-20 at GBX5,367 and MA-50 at GBX5,454. The MA-200 at GBX5,232 provides broader technical support. Momentum indicators remain weak, with hourly RSI at 36.04 and both MACD and ADX showing downside signals. Stoch RSI and CCI are neutral, while Bull/Bear Power reflects ongoing intraday seller dominance in oversold conditions. The Awesome Oscillator is neutral, indicating a lack of clear trend confirmation.
Range-bound trading likely as downside risks edge higher
In the short term, RKT/GBX is expected to trade between GBX5,020 and GBX5,523, representing the current volatility band relative to recent levels. The probability of a move higher is moderate at 44%, while the chance of a downward move is slightly greater at 56%. Consolidation within this range is likely if the price remains directionless. A break above GBX5,353 would activate a bullish scenario, whereas sustained trading below support near GBX5,020 could prompt further downside.
Earlier, analysts noted that Reckitt Benckiser was experiencing mixed technical momentum and ongoing operational headwinds that tempered the outlook for sustained gains. The latest price action and updated guidance reinforce the cautious tone, making it essential to monitor for a decisive move above GBX5,353 or below GBX5,020 to determine the next directional trend.










-
 Afghanistan
-
 Albania
-
 Algeria
-
 Angola
-
 Argentina
-
 Armenia
-
 Australia
-
 Austria
-
 Azerbaijan
-
 Bahamas
-
 Bahrain
-
 Bangladesh
-
 Belarus
-
 Belgium
-
 Bolivia
-
 Botswana
-
 Brazil
-
 Brunei
-
 Bulgaria
-
 Cambodia
-
 Cameroon
-
 Canada
-
 Chile
-
 China
-
 Colombia
-
 Congo
-
 Costa Rica
-
 Cote d'Ivoire
-
 Croatia
-
 Cuba
-
 Cyprus
-
 Czechia
-
 DR Congo
-
 Denmark
-
 Dominican Republic
-
 Ecuador
-
 Egypt
-
 El Salvador
-
 Estonia
-
 Eswatini
-
 Ethiopia
-
 Finland
-
 France
-
 Georgia
-
 Germany
-
 Ghana
-
 Greece
-
 Haiti
-
 Hong Kong
-
 Hungary
-
 India
-
 Indonesia
-
 Iran, Islamic republic
-
 Iraq
-
 Ireland
-
 Israel
-
 Italy
-
 Jamaica
-
 Japan
-
 Jordan
-
 Kazakhstan
-
 Kenya
-
 Korea
-
 Kuwait
-
 Kyrgyzstan
-
 Laos
-
 Latvia
-
 Lebanon
-
 Lesotho
-
 Libya
-
 Lithuania
-
 Luxembourg
-
 Madagascar
-
 Malaysia
-
 Malta
-
 Mauritius
-
 Mexico
-
 Moldova
-
 Mongolia
-
 Montenegro
-
 Morocco
-
 Mozambique
-
 Myanmar
-
 Namibia
-
 Nepal
-
 Netherlands
-
 New Zealand
-
 Nigeria
-
 North Macedonia
-
 Norway
-
 Oman
-
 Pakistan
-
 Palestine
-
 Panama
-
 Papua New Guinea
-
 Paraguay
-
 Peru
-
 Philippines
-
 Poland
-
 Portugal
-
 Puerto Rico
-
 Qatar
-
 Reunion
-
 Romania
-
 Rwanda
-
 Saudi Arabia
-
 Serbia
-
 Singapore
-
 Slovakia
-
 Slovenia
-
 Somalia
-
 South Africa
-
 Spain
-
 Sri Lanka
-
 Sweden
-
 Switzerland
-
 Syria
-
 Taiwan
-
 Tajikistan
-
 Tanzania
-
 Thailand
-
 Trinidad and Tobago
-
 Tunisia
-
 Turkey
-
 UAE
-
 Uganda
-
 Ukraine
-
 United Kingdom
-
United States
-
 Uruguay
-
 Uzbekistan
-
 Venezuela
-
 Vietnam
-
 Yemen
-
 Zambia
-
 Zimbabwe
- Forex
- Crypto












