

AMD shares trend constructive but stall below $563.66 resistance: weekly analysis

Shares of Advanced Micro Devices (AMD) are trading near $560 after climbing around 8% this week, propelled by a rebound from recent lows and growing interest in AI chips. The chart shows a constructive structure but warns of possible short-term overheating, as technical signals are mixed and resistance remains firm — setting the stage for a test of key levels in the days ahead.
 519.58
578.75
Highlights
- Shares of AMD rose 8.3% in the past week to $559.6, closing at the top of the weekly range.
- The stock displays a bullish longer-term structure with recent pullback pressure and possible short-term overheating.
- For the next five trading days, the expected range is $532.31 to $586.88, with a 63% probability of further gains and a base case for consolidation between $543.72 and $563.66.
Revenue surge and Meta investment drive bullish sentiment over the week
AMD saw significant momentum after reporting a 50% year-over-year revenue increase and booking substantial AI accelerator commitments, according to 24/7 Wall St. Investor sentiment further improved as Meta began testing AMD's Helios platform and announced a $1 billion investment in the company, GuruFocus noted. Hopes for sustained gains are also tied to the company's upcoming Q3 2026 earnings, with analysts currently expecting $13.08 billion in revenue.
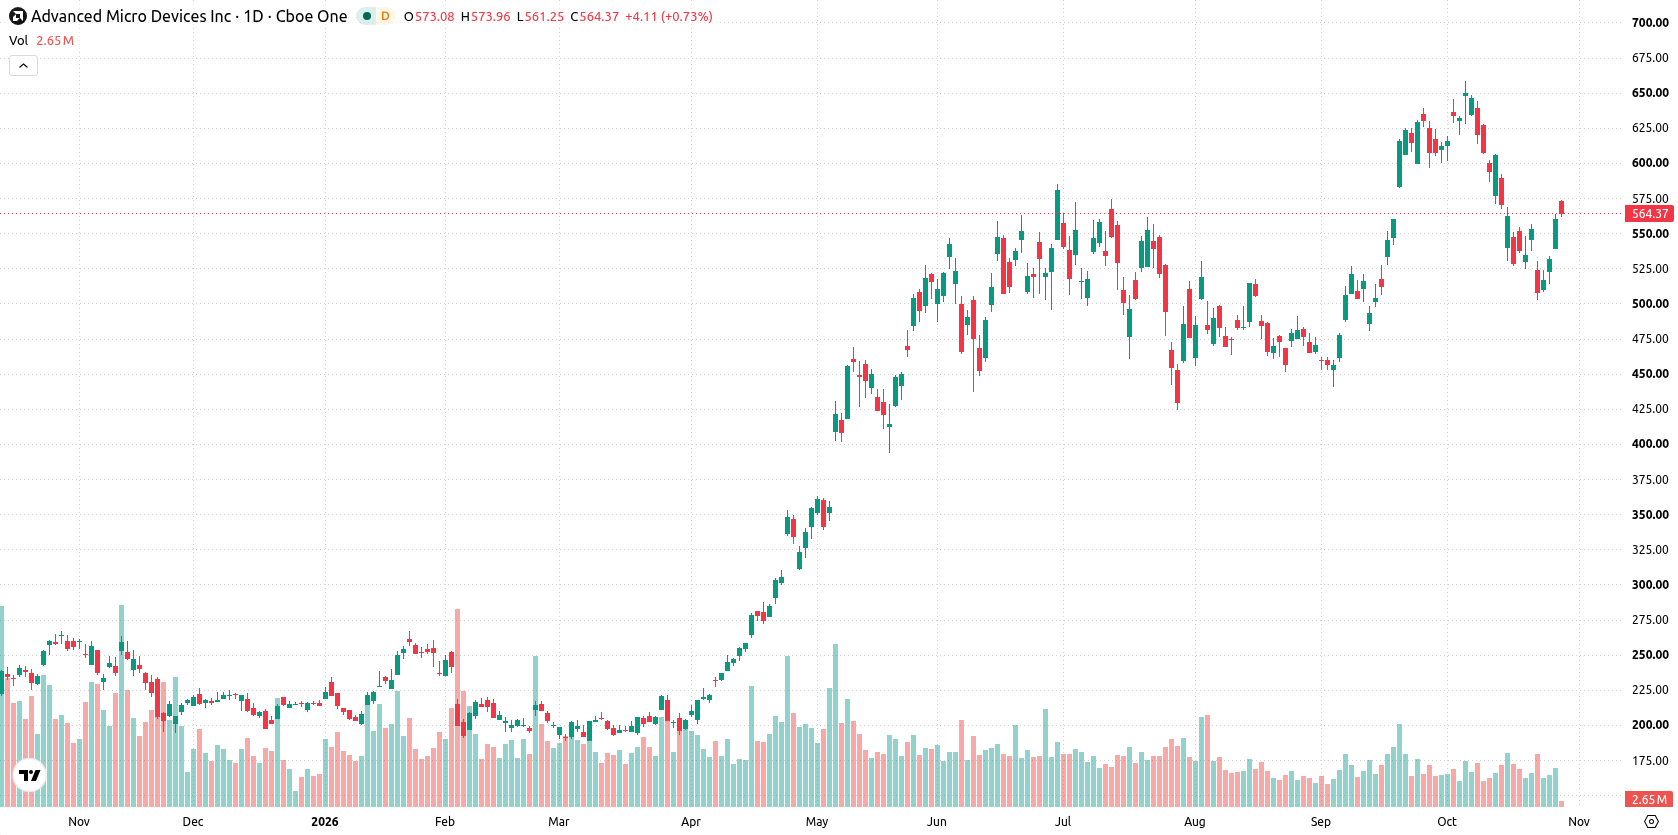
Upside momentum stalls as mixed signals flag overheating risk this week
On the daily chart, the structure is constructive after a sharp move higher without a sustained trend, with volatility at 12.14%. Momentum signals are mixed—a neutral zone reading for RSI (49.79) contrasts with a Sell signal on the MACD, while Bull/Bear Power registers as overbought, highlighting possible short-term overheating. Immediate resistance aligns with the recent high at $563.66, with the next support from the 50-day average at $543.72 and the Ichimoku Kijun acting as resistance at $580.54. This setup points to a developing trend with both upside continuation and correction risks over the coming days.
Consolidation base case as breakout scenarios hinge on resistance and support
For the next five trading days, the expected range is $532.31 to $586.88. The probability of an increase is 63%, while the probability of a decrease is 37%. The base case is for the stock to consolidate between $543.72 and $563.66. A move above $563.66 would open the way toward the top end of the band, while a fall below $543.72 would suggest deeper retracement toward $532.31.
Previously it was reported that AMD's technical setup hinged on the ability to overcome resistance as partnerships with major firms drove its enterprise AI narrative. The current analysis adds that near-term volatility remains elevated, making monitoring the $543.72–$563.66 consolidation range critical for assessing whether a breakout or retracement is likely.











-
 Afghanistan
-
 Albania
-
 Algeria
-
 Angola
-
 Argentina
-
 Armenia
-
 Australia
-
 Austria
-
 Azerbaijan
-
 Bahamas
-
 Bahrain
-
 Bangladesh
-
 Belarus
-
 Belgium
-
 Bolivia
-
 Botswana
-
 Brazil
-
 Brunei
-
 Bulgaria
-
 Cambodia
-
 Cameroon
-
 Canada
-
 Chile
-
 China
-
 Colombia
-
 Congo
-
 Costa Rica
-
 Cote d'Ivoire
-
 Croatia
-
 Cuba
-
 Cyprus
-
 Czechia
-
 DR Congo
-
 Denmark
-
 Dominican Republic
-
 Ecuador
-
 Egypt
-
 El Salvador
-
 Estonia
-
 Eswatini
-
 Ethiopia
-
 Finland
-
 France
-
 Georgia
-
 Germany
-
 Ghana
-
 Greece
-
 Haiti
-
 Hong Kong
-
 Hungary
-
 India
-
 Indonesia
-
 Iran, Islamic republic
-
 Iraq
-
 Ireland
-
 Israel
-
 Italy
-
 Jamaica
-
 Japan
-
 Jordan
-
 Kazakhstan
-
 Kenya
-
 Korea
-
 Kuwait
-
 Kyrgyzstan
-
 Laos
-
 Latvia
-
 Lebanon
-
 Lesotho
-
 Libya
-
 Lithuania
-
 Luxembourg
-
 Madagascar
-
 Malaysia
-
 Malta
-
 Mauritius
-
 Mexico
-
 Moldova
-
 Mongolia
-
 Montenegro
-
 Morocco
-
 Mozambique
-
 Myanmar
-
 Namibia
-
 Nepal
-
 Netherlands
-
 New Zealand
-
 Nigeria
-
 North Macedonia
-
 Norway
-
 Oman
-
 Pakistan
-
 Palestine
-
 Panama
-
 Papua New Guinea
-
 Paraguay
-
 Peru
-
 Philippines
-
 Poland
-
 Portugal
-
 Puerto Rico
-
 Qatar
-
 Reunion
-
 Romania
-
 Rwanda
-
 Saudi Arabia
-
 Serbia
-
 Singapore
-
 Slovakia
-
 Slovenia
-
 Somalia
-
 South Africa
-
 Spain
-
 Sri Lanka
-
 Sweden
-
 Switzerland
-
 Syria
-
 Taiwan
-
 Tajikistan
-
 Tanzania
-
 Thailand
-
 Trinidad and Tobago
-
 Tunisia
-
 Turkey
-
 UAE
-
 Uganda
-
 Ukraine
-
 United Kingdom
-
United States
-
 Uruguay
-
 Uzbekistan
-
 Venezuela
-
 Vietnam
-
 Yemen
-
 Zambia
-
 Zimbabwe
- Forex
- Crypto












