

Goldman Sachs shares hold gains as overbought readings signal near-term resistance: weekly analysis

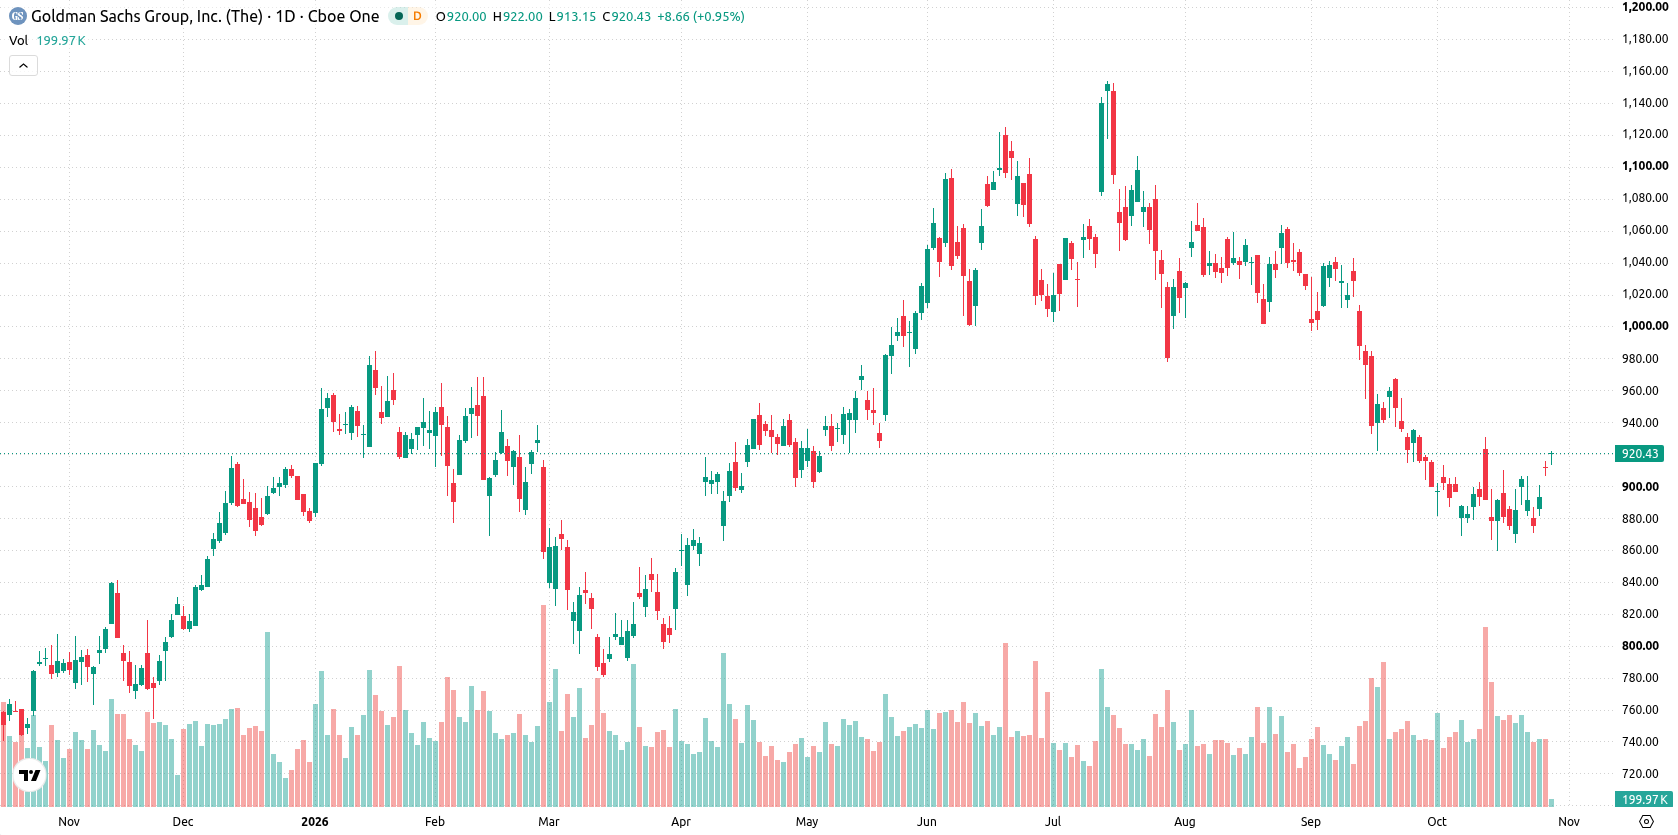
Shares of Goldman Sachs Group, Inc. (GS) are trading near $920 after a strong week, gaining nearly 5% as momentum held up despite some overbought readings on the chart. Bulls have pushed the recovery, but mixed signals and a stretched technical setup suggest the move may be running into resistance going into the week ahead.
 889.97
920.47
Highlights
- Shares of Goldman Sachs rose 4.93% over the past 7 days to $919.76, closing at the top of the weekly range.
- The stock trades above its 20-day moving average but remains below its 50-day and 200-day averages, indicating a bearish long-term structure.
- Overbought technical indicators and short-term momentum create risks for a correction, with an expected range of $889.9 to $936.93 and probability favoring consolidation.
AI-driven expansion and institutional demand lift sentiment during the week
Goldman Sachs played a lead role as a joint bookrunner for the planned Anthropic IPO, highlighting the bank's drive to capitalize on emerging AI opportunities, according to Yahoo Finance. On October 27, 2026, GuruFocus reported the company released a report underlining artificial intelligence as a key industry driver while citing its healthy dividend and solid valuation. The current backdrop also includes recent increases in institutional holdings, a 23% year-over-year rise in third-quarter revenue, and notable multi-year share price performance, as noted in MarketBeat.
Momentum stalls as overbought indicators flag risk of short-term pullback
On the daily chart, a sustained move higher with a firm trend is evident, with volatility at 4.39%. Momentum signals are divided: the CCI and Stochastic RSI are both overbought, which indicates some risk of a short-term correction, while the RSI holds in a neutral zone. The nearest support is $913.65, close to the current price, with additional support at the Ichimoku Kijun around $909.74, while the next resistance is at $954.03. This setup suggests upward momentum is intact but is facing possible exhaustion if overbought signals weigh on price action.
Consolidation favored next week unless breakout levels are breached
Over the coming trading week, the expected range is $889.9 to $936.93, with a 43% probability of an increase and a 57% probability of a decrease. The base case favors consolidation within this range as the stock digests recent gains. A sustained push above $954.03 would open room for further upside, while a drop below $913.65 would signal risk of deeper retracement toward the lower end of the range.
Previously it was reported that Goldman Sachs delivered strong quarterly results, supported by gains in core business units and resilient dividend performance, while navigating mixed technical momentum. The current context reinforces the backdrop of robust earnings and expanding AI initiatives, with traders advised to monitor the $913.65 support and $954.03 resistance as potential inflection points for the next move.










-
 Afghanistan
-
 Albania
-
 Algeria
-
 Angola
-
 Argentina
-
 Armenia
-
 Australia
-
 Austria
-
 Azerbaijan
-
 Bahamas
-
 Bahrain
-
 Bangladesh
-
 Belarus
-
 Belgium
-
 Bolivia
-
 Botswana
-
 Brazil
-
 Brunei
-
 Bulgaria
-
 Cambodia
-
 Cameroon
-
 Canada
-
 Chile
-
 China
-
 Colombia
-
 Congo
-
 Costa Rica
-
 Cote d'Ivoire
-
 Croatia
-
 Cuba
-
 Cyprus
-
 Czechia
-
 DR Congo
-
 Denmark
-
 Dominican Republic
-
 Ecuador
-
 Egypt
-
 El Salvador
-
 Estonia
-
 Eswatini
-
 Ethiopia
-
 Finland
-
 France
-
 Georgia
-
 Germany
-
 Ghana
-
 Greece
-
 Haiti
-
 Hong Kong
-
 Hungary
-
 India
-
 Indonesia
-
 Iran, Islamic republic
-
 Iraq
-
 Ireland
-
 Israel
-
 Italy
-
 Jamaica
-
 Japan
-
 Jordan
-
 Kazakhstan
-
 Kenya
-
 Korea
-
 Kuwait
-
 Kyrgyzstan
-
 Laos
-
 Latvia
-
 Lebanon
-
 Lesotho
-
 Libya
-
 Lithuania
-
 Luxembourg
-
 Madagascar
-
 Malaysia
-
 Malta
-
 Mauritius
-
 Mexico
-
 Moldova
-
 Mongolia
-
 Montenegro
-
 Morocco
-
 Mozambique
-
 Myanmar
-
 Namibia
-
 Nepal
-
 Netherlands
-
 New Zealand
-
 Nigeria
-
 North Macedonia
-
 Norway
-
 Oman
-
 Pakistan
-
 Palestine
-
 Panama
-
 Papua New Guinea
-
 Paraguay
-
 Peru
-
 Philippines
-
 Poland
-
 Portugal
-
 Puerto Rico
-
 Qatar
-
 Reunion
-
 Romania
-
 Rwanda
-
 Saudi Arabia
-
 Serbia
-
 Singapore
-
 Slovakia
-
 Slovenia
-
 Somalia
-
 South Africa
-
 Spain
-
 Sri Lanka
-
 Sweden
-
 Switzerland
-
 Syria
-
 Taiwan
-
 Tajikistan
-
 Tanzania
-
 Thailand
-
 Trinidad and Tobago
-
 Tunisia
-
 Turkey
-
 UAE
-
 Uganda
-
 Ukraine
-
 United Kingdom
-
United States
-
 Uruguay
-
 Uzbekistan
-
 Venezuela
-
 Vietnam
-
 Yemen
-
 Zambia
-
 Zimbabwe
- Forex
- Crypto












