

Verizon shares weekly forecast: Recovery hopes limited despite raised guidance and new AI partnerships

Shares of Verizon Communications Inc. (VZ) are trading near $44 after slipping more than 1% over the past week. Despite upbeat signals around core business trends, rebound odds remain low as investors weigh results and fresh spending commitments heading into next week.
 45.16
45.16
Highlights
- Shares of Verizon closed at $44.03, falling $0.58 over the past 7 days and remaining below key daily moving averages.
- Technical indicators confirm a bearish short-term trend, with persistent downside momentum and resistance now at $44.29.
- The price is expected to trade between $42.97 and $45.04 over the next five days, with a high probability of further decline.
Raised guidance and AI deals temper revenue miss after Q3 results
Verizon reported third-quarter 2026 results with $34.3 billion in revenue and an 8.3% year-over-year increase in adjusted earnings per share, according to CNBC. Although revenue came in below analyst expectations, the company posted a record adjusted EBITDA margin of 40.2% and sharply raised its full-year guidance for earnings and cash flow. Verizon also announced new multi-year AI infrastructure partnerships totaling $4 billion with Amazon Web Services and Google, underscoring its push into fiber and edge computing this year.
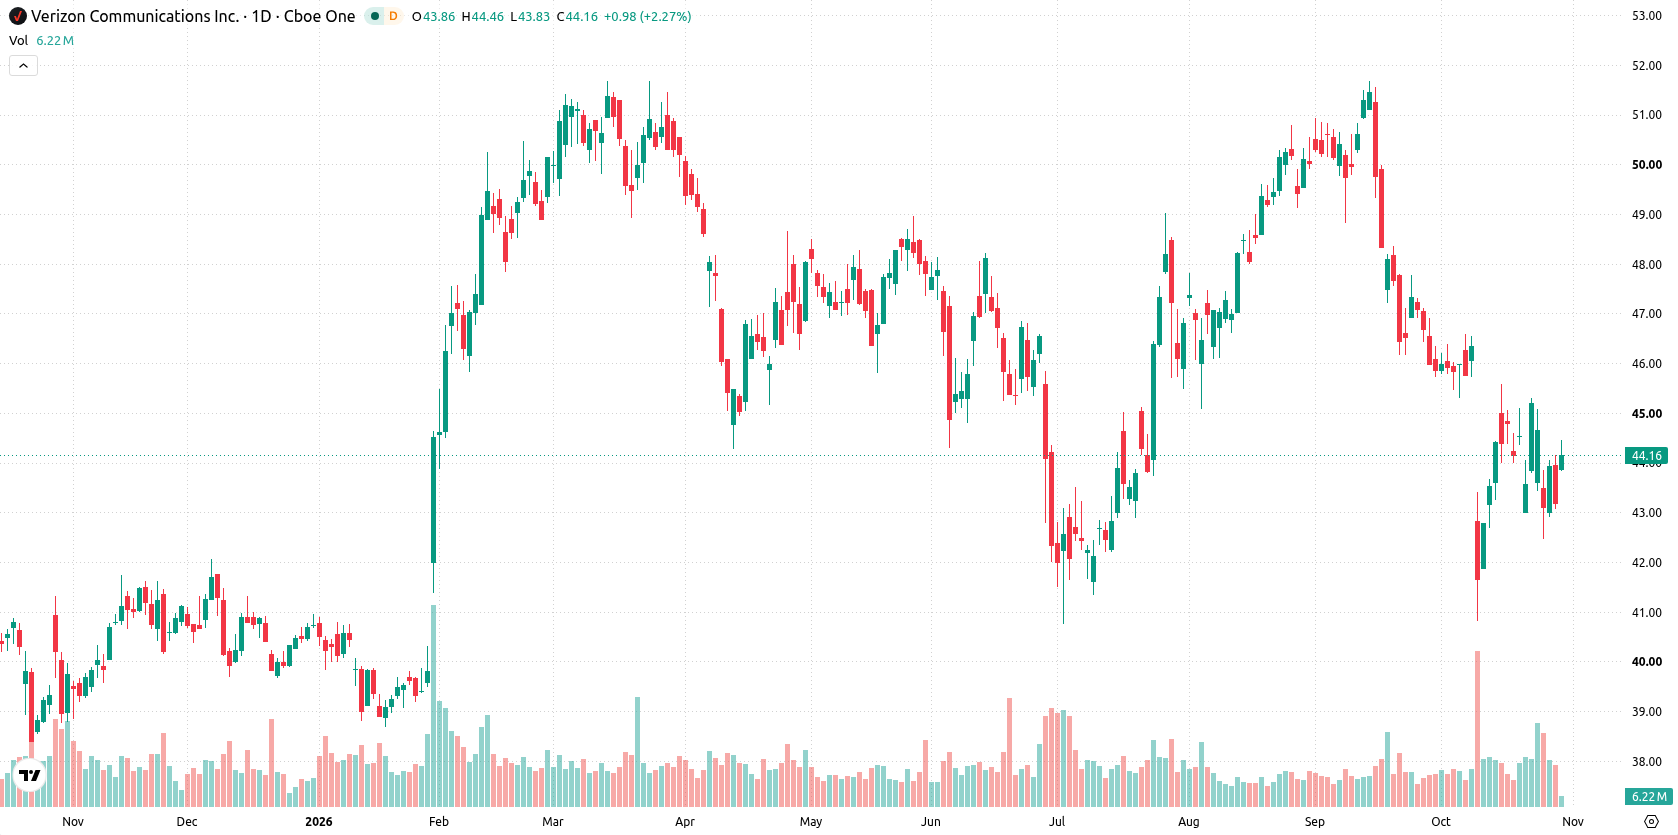
Downside momentum holds as MACD and ADX reinforce technical weakness
The daily chart reveals a sustained move lower with a firm trend, supported by sell signals from MACD and ADX, while level-based oscillators such as RSI (40.5) and CCI remain neutral. Bearish daily momentum is reinforced by volatility of 5.31% and price struggling beneath the Ichimoku Kijun at $44.29, now acting as resistance. The nearest support is $42.77, and the share price is currently trading in the middle of its recent weekly range. With the longer-term picture still negative, short-term momentum remains pointed to the downside.
Downside bias dominates as narrow range and breakout risk persist next week
For the next five trading days, shares are expected to trade between $42.97 and $45.04, with a very high probability of a decrease and very low probability of an increase. The base case is continued pressure inside this range. A move above resistance at $44.29 could open the way for a test of the upper boundary. Conversely, a break below support at $42.77 would likely accelerate further downside.
Previously it was reported that persistent technical weakness and ongoing competitive pressures were keeping downside risks elevated for Verizon shares, despite positive earnings and subscriber growth. The current analysis reinforces this cautious stance, highlighting $44.29 as a key resistance level to monitor, with continued downside risk if shares fail to reclaim this threshold in the coming sessions.









-
 Afghanistan
-
 Albania
-
 Algeria
-
 Angola
-
 Argentina
-
 Armenia
-
 Australia
-
 Austria
-
 Azerbaijan
-
 Bahamas
-
 Bahrain
-
 Bangladesh
-
 Belarus
-
 Belgium
-
 Bolivia
-
 Botswana
-
 Brazil
-
 Brunei
-
 Bulgaria
-
 Cambodia
-
 Cameroon
-
 Canada
-
 Chile
-
 China
-
 Colombia
-
 Congo
-
 Costa Rica
-
 Cote d'Ivoire
-
 Croatia
-
 Cuba
-
 Cyprus
-
 Czechia
-
 DR Congo
-
 Denmark
-
 Dominican Republic
-
 Ecuador
-
 Egypt
-
 El Salvador
-
 Estonia
-
 Eswatini
-
 Ethiopia
-
 Finland
-
 France
-
 Georgia
-
 Germany
-
 Ghana
-
 Greece
-
 Haiti
-
 Hong Kong
-
 Hungary
-
 India
-
 Indonesia
-
 Iran, Islamic republic
-
 Iraq
-
 Ireland
-
 Israel
-
 Italy
-
 Jamaica
-
 Japan
-
 Jordan
-
 Kazakhstan
-
 Kenya
-
 Korea
-
 Kuwait
-
 Kyrgyzstan
-
 Laos
-
 Latvia
-
 Lebanon
-
 Lesotho
-
 Libya
-
 Lithuania
-
 Luxembourg
-
 Madagascar
-
 Malaysia
-
 Malta
-
 Mauritius
-
 Mexico
-
 Moldova
-
 Mongolia
-
 Montenegro
-
 Morocco
-
 Mozambique
-
 Myanmar
-
 Namibia
-
 Nepal
-
 Netherlands
-
 New Zealand
-
 Nigeria
-
 North Macedonia
-
 Norway
-
 Oman
-
 Pakistan
-
 Palestine
-
 Panama
-
 Papua New Guinea
-
 Paraguay
-
 Peru
-
 Philippines
-
 Poland
-
 Portugal
-
 Puerto Rico
-
 Qatar
-
 Reunion
-
 Romania
-
 Rwanda
-
 Saudi Arabia
-
 Serbia
-
 Singapore
-
 Slovakia
-
 Slovenia
-
 Somalia
-
 South Africa
-
 Spain
-
 Sri Lanka
-
 Sweden
-
 Switzerland
-
 Syria
-
 Taiwan
-
 Tajikistan
-
 Tanzania
-
 Thailand
-
 Trinidad and Tobago
-
 Tunisia
-
 Turkey
-
 UAE
-
 Uganda
-
 Ukraine
-
 United Kingdom
-
United States
-
 Uruguay
-
 Uzbekistan
-
 Venezuela
-
 Vietnam
-
 Yemen
-
 Zambia
-
 Zimbabwe
- Forex
- Crypto












