

What's behind Suncor Energy's latest stock pullback?

Suncor Energy Inc. (SU) declined 3.01% as traders positioned ahead of its upcoming third-quarter 2026 earnings release, with no fresh positive catalysts present. The move is supported by sustained selling pressure, as the stock still trades above major moving averages but has encountered overbought conditions and intraday volatility near the midpoint of today's range.
 96.30
106.33
Highlights
- Suncor Energy will report third-quarter 2026 results on November 3, 2026 and recently paid its quarterly dividend.
- Shares of Suncor Energy are described as a dividend growth stock, with no major new corporate or regulatory actions disclosed.
- Suncor Energy stock trades above major moving averages, with a projected five-day range of C$105.56 to C$112.15 and upside signals prevailing.
Dividend profile and earnings timing sustain defensive sentiment
Suncor Energy announced it will release its third-quarter 2026 financial results on November 3, 2026, followed by an analyst webcast and Q&A session on November 4, 2026. The company recently paid a quarterly dividend and remains featured as a dividend growth stock. No other major regulatory or corporate actions have been reported, though price action has remained under broader selling pressure.
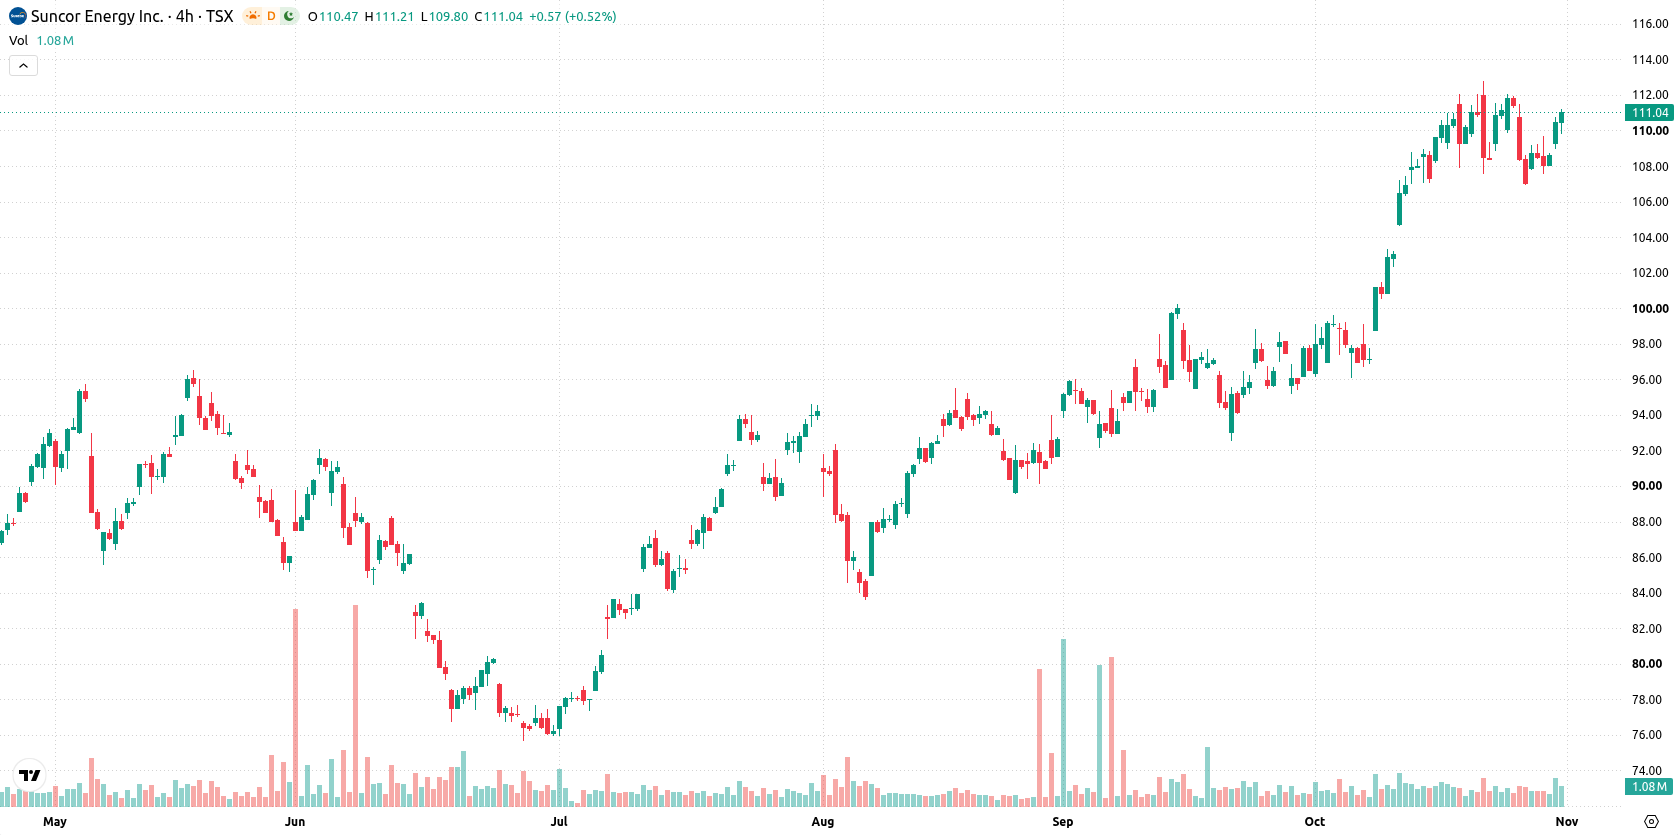
Bullish bias holds amid overbought signals and heightened volatility
Suncor Energy continues to trade above its 20-day, 50-day, and 200-day moving averages, positioned at C$107.8 against C$106.31, C$99.5, and C$87.9, respectively. This configuration maintains a bullish bias across all timeframes, with immediate resistance at C$108.81 and support at C$107.19 marking today's key trading corridor. Momentum remains skewed to the upside, as the MACD and ADX show strong buy signals, while the RSI, Stochastic RSI, and CCI are also in buy zones. However, BBP reflects overbought conditions, and session momentum is dominated by buyers, even as a C$2.65 gap and 3.01% daily loss highlight selling after the open. The Awesome Oscillator stands neutral and intraday volatility is at 1.51%.
Earlier, analysts noted that Suncor Energy was maintaining a bullish technical structure amid growing anticipation for its third-quarter 2026 financial results. The current decline, despite continued strength above key moving averages, adds new caution to the outlook, with near-term price action hinging on whether the stock can sustain consolidation within its projected C$105.56 to C$112.15 volatility band.






Latest Suncor Energy News


-
 Afghanistan
-
 Albania
-
 Algeria
-
 Angola
-
 Argentina
-
 Armenia
-
 Australia
-
 Austria
-
 Azerbaijan
-
 Bahamas
-
 Bahrain
-
 Bangladesh
-
 Belarus
-
 Belgium
-
 Bolivia
-
 Botswana
-
 Brazil
-
 Brunei
-
 Bulgaria
-
 Cambodia
-
 Cameroon
-
 Canada
-
 Chile
-
 China
-
 Colombia
-
 Congo
-
 Costa Rica
-
 Cote d'Ivoire
-
 Croatia
-
 Cuba
-
 Cyprus
-
 Czechia
-
 DR Congo
-
 Denmark
-
 Dominican Republic
-
 Ecuador
-
 Egypt
-
 El Salvador
-
 Estonia
-
 Eswatini
-
 Ethiopia
-
 Finland
-
 France
-
 Georgia
-
 Germany
-
 Ghana
-
 Greece
-
 Haiti
-
 Hong Kong
-
 Hungary
-
 India
-
 Indonesia
-
 Iran, Islamic republic
-
 Iraq
-
 Ireland
-
 Israel
-
 Italy
-
 Jamaica
-
 Japan
-
 Jordan
-
 Kazakhstan
-
 Kenya
-
 Korea
-
 Kuwait
-
 Kyrgyzstan
-
 Laos
-
 Latvia
-
 Lebanon
-
 Lesotho
-
 Libya
-
 Lithuania
-
 Luxembourg
-
 Madagascar
-
 Malaysia
-
 Malta
-
 Mauritius
-
 Mexico
-
 Moldova
-
 Mongolia
-
 Montenegro
-
 Morocco
-
 Mozambique
-
 Myanmar
-
 Namibia
-
 Nepal
-
 Netherlands
-
 New Zealand
-
 Nigeria
-
 North Macedonia
-
 Norway
-
 Oman
-
 Pakistan
-
 Palestine
-
 Panama
-
 Papua New Guinea
-
 Paraguay
-
 Peru
-
 Philippines
-
 Poland
-
 Portugal
-
 Puerto Rico
-
 Qatar
-
 Reunion
-
 Romania
-
 Rwanda
-
 Saudi Arabia
-
 Serbia
-
 Singapore
-
 Slovakia
-
 Slovenia
-
 Somalia
-
 South Africa
-
 Spain
-
 Sri Lanka
-
 Sweden
-
 Switzerland
-
 Syria
-
 Taiwan
-
 Tajikistan
-
 Tanzania
-
 Thailand
-
 Trinidad and Tobago
-
 Tunisia
-
 Turkey
-
 UAE
-
 Uganda
-
 Ukraine
-
 United Kingdom
-
United States
-
 Uruguay
-
 Uzbekistan
-
 Venezuela
-
 Vietnam
-
 Yemen
-
 Zambia
-
 Zimbabwe
- Forex
- Crypto












