

Will Agnico Eagle Mines stock break above C$241.04 resistance amid production growth plans?

Agnico Eagle Mines (AEM) stock is trading at C$239.56, marking a daily gain of 3.73%. The stock currently sits below its key moving averages, suggesting a period of technical weakness despite the recent uptick.
 240.01
256.51
Highlights
- Agnico Eagle Mines reported adjusted earnings of $2.61 to $2.62 per share and revenue of $3.54 billion, surpassing consensus estimates and showing year-over-year growth.
- The company warns that higher diesel prices and inflation may increase costs and pressure margins by 2027, affecting future profitability.
- Shares of Agnico Eagle Mines trade below key moving averages with a bearish momentum profile and a 65% probability of moving down within a C$225.68 to C$253.44 range.
Earnings surprise drives sentiment amid inflation margin risks
Agnico Eagle Mines delivered better-than-expected third-quarter results, with adjusted earnings rising to approximately $2.61–$2.62 per share and revenue reaching about $3.54 billion, both surpassing consensus estimates and showing significant growth over the prior year, according to Defenseworld. This outperformance highlights stronger operational execution and supports renewed investor interest in the stock. However, the company's warning about higher diesel prices and inflation-driven cost increases expected to pressure margins in 2027, as reported by Defenseworld, introduces a note of caution around future profitability. Agnico Eagle Mines is also pursuing up to 30% production growth over the next decade via projects and mine expansions, a move that may underpin long-term cash flow and shareholder returns, according to Americanbankingnews.
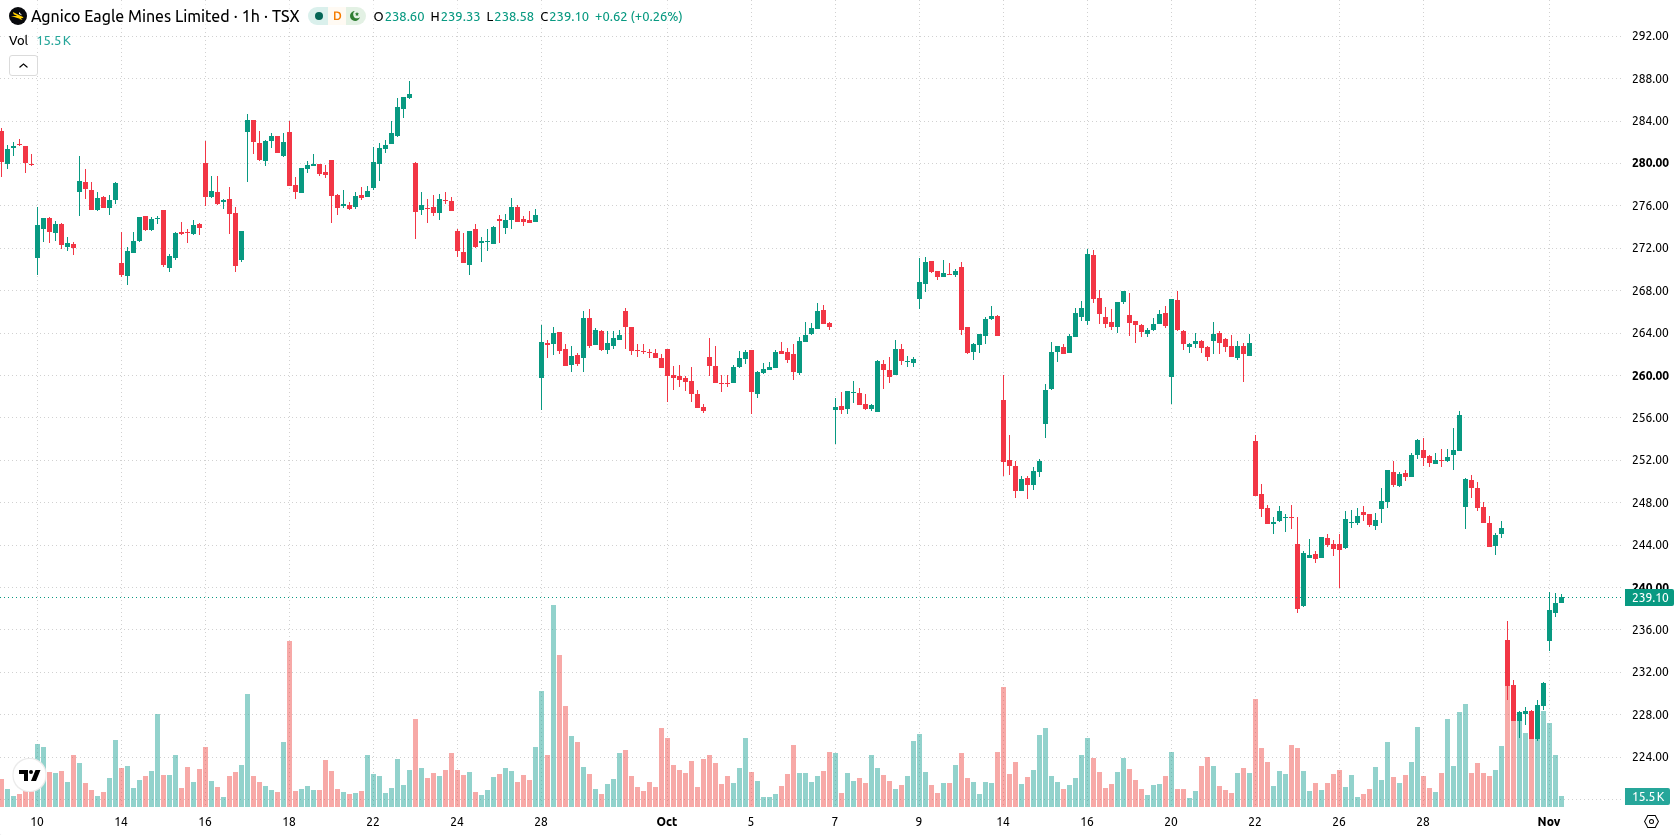
Bearish momentum dominates as AEM tests oversold indicators
On the H1 chart, AEM is trading below the MA-20 at C$242.25 and the MA-50 at C$245.33, and it remains under the daily MA-200 at C$262.84. The Ichimoku Kijun at C$241.04 forms immediate resistance. Momentum indicators signal prevailing bearish pressure: MACD, ADX, and CCI all flag Sell, with the RSI notably low at 32.9, close to oversold territory. Stochastic RSI and Awesome Oscillator are both Neutral, but Bull/Bear Power remains in oversold territory, pointing to clear intraday selling dominance.
Downside bias persists as resistance and low probability cap upside
In the short term, AEM is expected to consolidate within a volatility band of C$225.68 to C$253.44. The probability currently stands at 35% for upside movement and 65% for a downward swing, making a sustained advance less likely. Should the stock break above the resistance near C$241.04, a bullish scenario could materialize, while any decisive break below support may signal renewed downside momentum.
Earlier, analysts noted that Agnico Eagle Mines continued to face near-term technical headwinds despite resilient operational and financial performance. The current analysis adds a note of caution by highlighting inflation-driven cost pressures for 2027, making any sustained breakout above immediate resistance a critical level to watch for a shift in downside risk.






Latest Agnico Eagle News



-
 Afghanistan
-
 Albania
-
 Algeria
-
 Angola
-
 Argentina
-
 Armenia
-
 Australia
-
 Austria
-
 Azerbaijan
-
 Bahamas
-
 Bahrain
-
 Bangladesh
-
 Belarus
-
 Belgium
-
 Bolivia
-
 Botswana
-
 Brazil
-
 Brunei
-
 Bulgaria
-
 Cambodia
-
 Cameroon
-
 Canada
-
 Chile
-
 China
-
 Colombia
-
 Congo
-
 Costa Rica
-
 Cote d'Ivoire
-
 Croatia
-
 Cuba
-
 Cyprus
-
 Czechia
-
 DR Congo
-
 Denmark
-
 Dominican Republic
-
 Ecuador
-
 Egypt
-
 El Salvador
-
 Estonia
-
 Eswatini
-
 Ethiopia
-
 Finland
-
 France
-
 Georgia
-
 Germany
-
 Ghana
-
 Greece
-
 Haiti
-
 Hong Kong
-
 Hungary
-
 India
-
 Indonesia
-
 Iran, Islamic republic
-
 Iraq
-
 Ireland
-
 Israel
-
 Italy
-
 Jamaica
-
 Japan
-
 Jordan
-
 Kazakhstan
-
 Kenya
-
 Korea
-
 Kuwait
-
 Kyrgyzstan
-
 Laos
-
 Latvia
-
 Lebanon
-
 Lesotho
-
 Libya
-
 Lithuania
-
 Luxembourg
-
 Madagascar
-
 Malaysia
-
 Malta
-
 Mauritius
-
 Mexico
-
 Moldova
-
 Mongolia
-
 Montenegro
-
 Morocco
-
 Mozambique
-
 Myanmar
-
 Namibia
-
 Nepal
-
 Netherlands
-
 New Zealand
-
 Nigeria
-
 North Macedonia
-
 Norway
-
 Oman
-
 Pakistan
-
 Palestine
-
 Panama
-
 Papua New Guinea
-
 Paraguay
-
 Peru
-
 Philippines
-
 Poland
-
 Portugal
-
 Puerto Rico
-
 Qatar
-
 Reunion
-
 Romania
-
 Rwanda
-
 Saudi Arabia
-
 Serbia
-
 Singapore
-
 Slovakia
-
 Slovenia
-
 Somalia
-
 South Africa
-
 Spain
-
 Sri Lanka
-
 Sweden
-
 Switzerland
-
 Syria
-
 Taiwan
-
 Tajikistan
-
 Tanzania
-
 Thailand
-
 Trinidad and Tobago
-
 Tunisia
-
 Turkey
-
 UAE
-
 Uganda
-
 Ukraine
-
 United Kingdom
-
United States
-
 Uruguay
-
 Uzbekistan
-
 Venezuela
-
 Vietnam
-
 Yemen
-
 Zambia
-
 Zimbabwe
- Forex
- Crypto












