

Will Shell stock hold above GBX3,823 support amid ongoing downward price move?

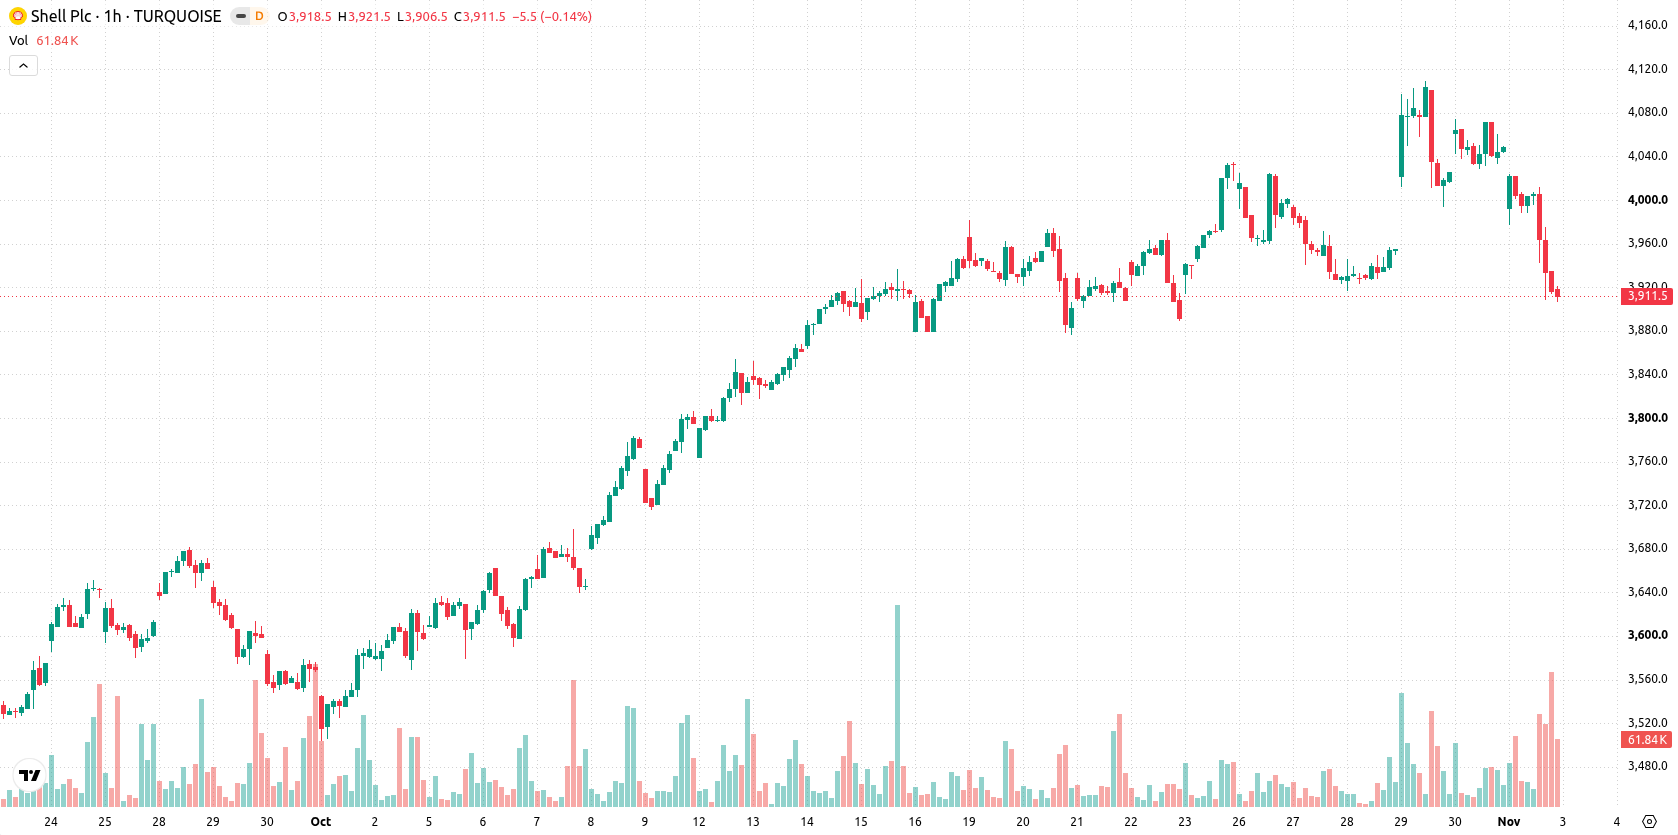
Shell (SHEL) stock is trading at GBX3,910, marking a daily decline of 3.13%. The price currently sits below its key short- and medium-term moving averages, indicating sustained pressure relative to recent trading levels.
 4025.00
4110.00
Highlights
- Shell posted third-quarter adjusted earnings of $10.8 billion and an EPS of $3.86, beating consensus forecasts.
- The company approved a $5 billion share buyback, declared a $0.3906 dividend, and sold its Na Kika stake for $840 million.
- Shares of Shell declined 3.13% to GBX3,910, trading below key moving averages with prevailing downside momentum and a projected range of GBX3,823 to GBX3,996.
Earnings beat and buybacks tempered by market-wide selling
Shell reported third-quarter adjusted earnings of approximately $10.8 billion, with an EPS of $3.86 that surpassed consensus forecasts, according to Gurufocus. The company also authorized a $5 billion share buyback and declared a quarterly dividend of $0.3906 per share, returning additional capital to investors and increasing near-term liquidity. In addition, Shell repurchased shares for cancellation as part of its ongoing buyback program on October 30, 2026, and sold its 50% non-operated stake in the Na Kika platform and related Gulf of Mexico fields for about $840 million, effective as of September 2026. These positive corporate actions were accompanied by broad selling pressure in the market.
Seller momentum dominates as technical levels signal oversold conditions
On the H1 timeframe, SHEL is trading below the MA-20 at GBX4,012 and the MA-50 at GBX3,994, while still holding above the MA-200 on the daily chart at GBX3,283. The Ichimoku Kijun level at GBX4,008 forms immediate resistance. Momentum signals align to the downside, with MACD and ADX both highlighting continued weakness. RSI stands at 30.9, while Stoch RSI, CCI, and Bull/Bear Power all confirm oversold conditions, highlighting strong seller dominance intraday. The Awesome Oscillator reinforces the bearish tone present in current intraday trading.
Downside risk heightened as trading range narrows near support
In the short term, SHEL is expected to trade within a range of GBX3,823 to GBX3,996 over the next several sessions, defining the volatility band relative to current levels. There is a 73% probability of further downside, while the chance of a recovery is limited to 27%, making upside scenarios less likely unless price breaks through GBX4,008 resistance. Should price sustain above this threshold, a bullish scenario could emerge, while a decline below GBX3,823 would point to further downside risk.
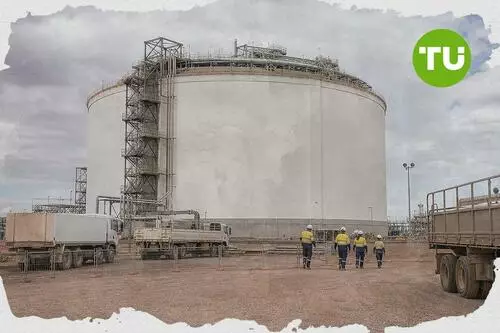
Previously it was reported that Shell agreed to sell its stakes in major natural gas infrastructure projects as part of a broader asset rebalancing strategy. The current technical backdrop highlights continued selling pressure, so traders should closely monitor the GBX4,008 resistance level for any potential shift toward bullish momentum.









-
 Afghanistan
-
 Albania
-
 Algeria
-
 Angola
-
 Argentina
-
 Armenia
-
 Australia
-
 Austria
-
 Azerbaijan
-
 Bahamas
-
 Bahrain
-
 Bangladesh
-
 Belarus
-
 Belgium
-
 Bolivia
-
 Botswana
-
 Brazil
-
 Brunei
-
 Bulgaria
-
 Cambodia
-
 Cameroon
-
 Canada
-
 Chile
-
 China
-
 Colombia
-
 Congo
-
 Costa Rica
-
 Cote d'Ivoire
-
 Croatia
-
 Cuba
-
 Cyprus
-
 Czechia
-
 DR Congo
-
 Denmark
-
 Dominican Republic
-
 Ecuador
-
 Egypt
-
 El Salvador
-
 Estonia
-
 Eswatini
-
 Ethiopia
-
 Finland
-
 France
-
 Georgia
-
 Germany
-
 Ghana
-
 Greece
-
 Haiti
-
 Hong Kong
-
 Hungary
-
 India
-
 Indonesia
-
 Iran, Islamic republic
-
 Iraq
-
 Ireland
-
 Israel
-
 Italy
-
 Jamaica
-
 Japan
-
 Jordan
-
 Kazakhstan
-
 Kenya
-
 Korea
-
 Kuwait
-
 Kyrgyzstan
-
 Laos
-
 Latvia
-
 Lebanon
-
 Lesotho
-
 Libya
-
 Lithuania
-
 Luxembourg
-
 Madagascar
-
 Malaysia
-
 Malta
-
 Mauritius
-
 Mexico
-
 Moldova
-
 Mongolia
-
 Montenegro
-
 Morocco
-
 Mozambique
-
 Myanmar
-
 Namibia
-
 Nepal
-
 Netherlands
-
 New Zealand
-
 Nigeria
-
 North Macedonia
-
 Norway
-
 Oman
-
 Pakistan
-
 Palestine
-
 Panama
-
 Papua New Guinea
-
 Paraguay
-
 Peru
-
 Philippines
-
 Poland
-
 Portugal
-
 Puerto Rico
-
 Qatar
-
 Reunion
-
 Romania
-
 Rwanda
-
 Saudi Arabia
-
 Serbia
-
 Singapore
-
 Slovakia
-
 Slovenia
-
 Somalia
-
 South Africa
-
 Spain
-
 Sri Lanka
-
 Sweden
-
 Switzerland
-
 Syria
-
 Taiwan
-
 Tajikistan
-
 Tanzania
-
 Thailand
-
 Trinidad and Tobago
-
 Tunisia
-
 Turkey
-
 UAE
-
 Uganda
-
 Ukraine
-
 United Kingdom
-
United States
-
 Uruguay
-
 Uzbekistan
-
 Venezuela
-
 Vietnam
-
 Yemen
-
 Zambia
-
 Zimbabwe
- Forex
- Crypto












