

Suncor Energy stock holds steady while oversold Stoch RSI signals limited downside risk

Suncor Energy (SU) stock is trading at C$105.64, up slightly for the session. The stock is currently positioned below its key short- and medium-term moving averages but remains above longer-term trend levels.
 96.30
106.33
Highlights
- SU/CAD trades below short- and medium-term moving averages, indicating ongoing bearish pressure, but remains above its long-term trend line.
- Momentum indicators are bearish, with weak trend signals and multiple oscillators in the oversold zone, hinting at a possible short-term rebound.
- Price is forecast to consolidate between C$103.05 and C$108.23 in the coming days, with a 73% probability of a downside move.
Bearish momentum dominates as oversold signals suggest rebound risk
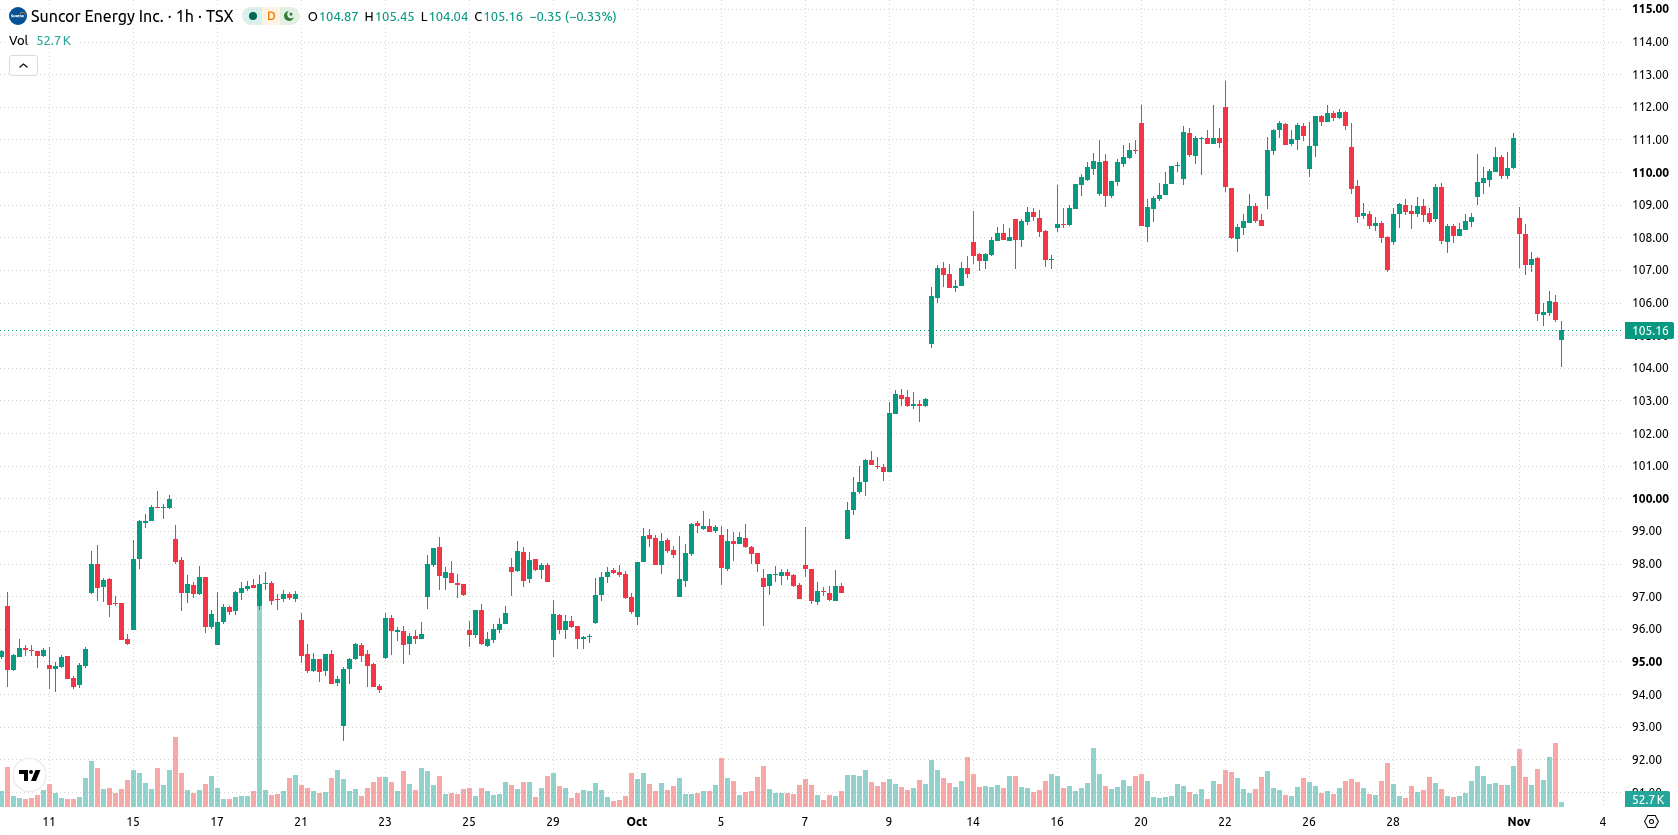
On the technical side, SU/CAD is trading below both the MA-20 (C$108.33) and MA-50 (C$109.27) on the hourly chart, while the price is holding above the MA-200 (C$88.09, daily). The Ichimoku Kijun level at C$108.22 acts as immediate resistance. Momentum signals remain bearish, with MACD and ADX indicating persistent selling pressure. RSI is neutral, but both Stoch RSI and CCI are in the oversold zone, suggesting a potential near-term rebound despite weak overall momentum. Bull/Bear Power is negative, confirming seller dominance, and the Awesome Oscillator aligns with this bias.
Range-bound outlook as downside break risk outweighs upside
In the short term, SU/CAD is expected to consolidate within a range of C$103.05 to C$108.23, which represents a typical volatility band relative to current levels. There is a 27% probability of an upward move from here, while the downside scenario is more likely at 73%. An upside breakout above C$108.22 would clear immediate resistance and could trigger further gains, whereas a drop below C$103.05 would reinforce the prevailing downside bias.
Earlier, analysts noted that Suncor Energy was displaying a cautious technical posture amid overbought signals and heightened volatility, with support and resistance levels defining its immediate outlook. The current analysis builds on this view by highlighting a prevailing downside bias, making the C$103.05 support level an important threshold to monitor for further risk in the days ahead.






Latest Suncor Energy News


-
 Afghanistan
-
 Albania
-
 Algeria
-
 Angola
-
 Argentina
-
 Armenia
-
 Australia
-
 Austria
-
 Azerbaijan
-
 Bahamas
-
 Bahrain
-
 Bangladesh
-
 Belarus
-
 Belgium
-
 Bolivia
-
 Botswana
-
 Brazil
-
 Brunei
-
 Bulgaria
-
 Cambodia
-
 Cameroon
-
 Canada
-
 Chile
-
 China
-
 Colombia
-
 Congo
-
 Costa Rica
-
 Cote d'Ivoire
-
 Croatia
-
 Cuba
-
 Cyprus
-
 Czechia
-
 DR Congo
-
 Denmark
-
 Dominican Republic
-
 Ecuador
-
 Egypt
-
 El Salvador
-
 Estonia
-
 Eswatini
-
 Ethiopia
-
 Finland
-
 France
-
 Georgia
-
 Germany
-
 Ghana
-
 Greece
-
 Haiti
-
 Hong Kong
-
 Hungary
-
 India
-
 Indonesia
-
 Iran, Islamic republic
-
 Iraq
-
 Ireland
-
 Israel
-
 Italy
-
 Jamaica
-
 Japan
-
 Jordan
-
 Kazakhstan
-
 Kenya
-
 Korea
-
 Kuwait
-
 Kyrgyzstan
-
 Laos
-
 Latvia
-
 Lebanon
-
 Lesotho
-
 Libya
-
 Lithuania
-
 Luxembourg
-
 Madagascar
-
 Malaysia
-
 Malta
-
 Mauritius
-
 Mexico
-
 Moldova
-
 Mongolia
-
 Montenegro
-
 Morocco
-
 Mozambique
-
 Myanmar
-
 Namibia
-
 Nepal
-
 Netherlands
-
 New Zealand
-
 Nigeria
-
 North Macedonia
-
 Norway
-
 Oman
-
 Pakistan
-
 Palestine
-
 Panama
-
 Papua New Guinea
-
 Paraguay
-
 Peru
-
 Philippines
-
 Poland
-
 Portugal
-
 Puerto Rico
-
 Qatar
-
 Reunion
-
 Romania
-
 Rwanda
-
 Saudi Arabia
-
 Serbia
-
 Singapore
-
 Slovakia
-
 Slovenia
-
 Somalia
-
 South Africa
-
 Spain
-
 Sri Lanka
-
 Sweden
-
 Switzerland
-
 Syria
-
 Taiwan
-
 Tajikistan
-
 Tanzania
-
 Thailand
-
 Trinidad and Tobago
-
 Tunisia
-
 Turkey
-
 UAE
-
 Uganda
-
 Ukraine
-
 United Kingdom
-
United States
-
 Uruguay
-
 Uzbekistan
-
 Venezuela
-
 Vietnam
-
 Yemen
-
 Zambia
-
 Zimbabwe
- Forex
- Crypto












