

Suncor Energy stock faces support pressure as overbought conditions signal limited upside

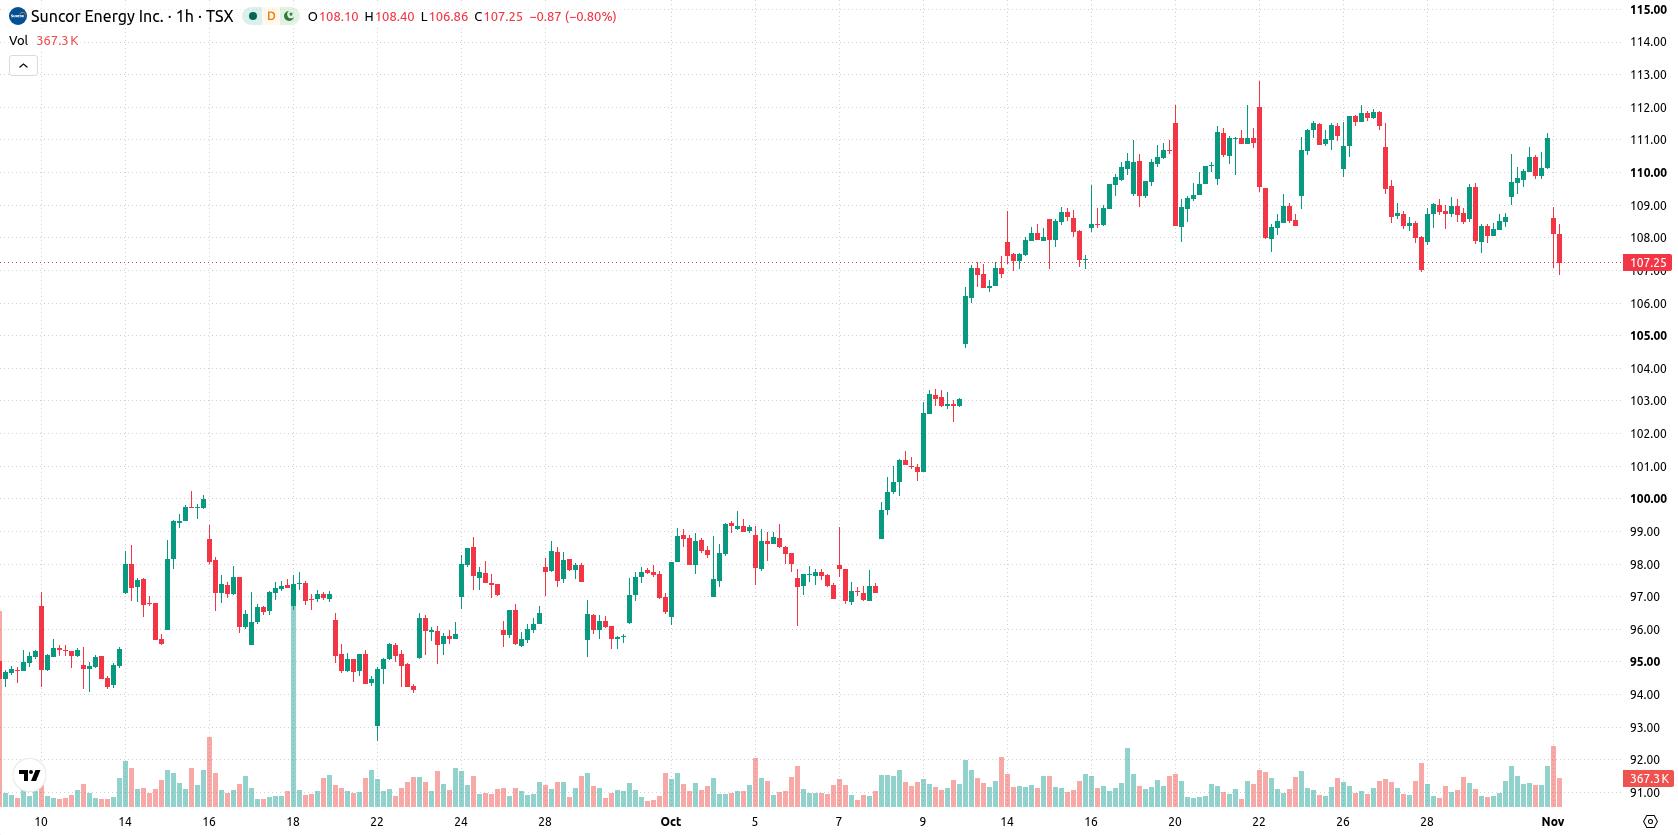
Suncor Energy (SU) stock is trading at C$107.3, reflecting a daily decline of 3.46%. The stock currently sits below its key short- and medium-term moving averages, while technical long-term support remains intact.
 108.93
111.42
Highlights
- Suncor Energy stock trades below key short- and medium-term moving averages, indicating bearish pressure in the near term.
- Momentum indicators are mixed, with buying signals persisting but overbought conditions and seller activity driving volatility.
- The price is expected to consolidate in a C$105.3 to C$109.3 range, with a higher probability of downward movement.
Overbought signals and resistance clash amid persistent upside momentum
On the h1 timeframe, SU trades below the MA-20 at C$109.16 and the MA-50 at C$109.62, while remaining well above the daily MA-200 at C$87.9. The Ichimoku Kijun level at C$109.05 acts as immediate resistance. Today's drop brought the price to C$107.3, nearly filling a C$2.65 gap, and places it close to the session low. MACD and ADX indicate ongoing buying momentum, supported by the Awesome Oscillator, but RSI at 62.67 also points to an overbought condition. Stoch RSI, CCI, and Bull/Bear Power confirm overbought intraday readings with clear buyer dominance, highlighting a divergence between momentum signals and oscillators that signals the risk of a near-term reversal or at least increased caution for further upside.
Balanced breakout risk as support and resistance define trading range
In the short term, SU is expected to consolidate in a C$105.3–C$109.3 range, with moderate volatility. The probability of an upward breakout is currently seen at 35%. A clear move above immediate resistance could spark renewed buying interest, while a drop below C$105.3 would expose further downside risk in line with prevailing probabilities.
Earlier, analysts noted that Suncor Energy was maintaining a bullish technical structure despite experiencing overbought conditions and increased volatility. The present breakdown below key moving averages introduces a more cautious tone, making the C$105.3 support level critical for assessing potential downside risk if momentum weakens further.






Latest Suncor Energy News


-
 Afghanistan
-
 Albania
-
 Algeria
-
 Angola
-
 Argentina
-
 Armenia
-
 Australia
-
 Austria
-
 Azerbaijan
-
 Bahamas
-
 Bahrain
-
 Bangladesh
-
 Belarus
-
 Belgium
-
 Bolivia
-
 Botswana
-
 Brazil
-
 Brunei
-
 Bulgaria
-
 Cambodia
-
 Cameroon
-
 Canada
-
 Chile
-
 China
-
 Colombia
-
 Congo
-
 Costa Rica
-
 Cote d'Ivoire
-
 Croatia
-
 Cuba
-
 Cyprus
-
 Czechia
-
 DR Congo
-
 Denmark
-
 Dominican Republic
-
 Ecuador
-
 Egypt
-
 El Salvador
-
 Estonia
-
 Eswatini
-
 Ethiopia
-
 Finland
-
 France
-
 Georgia
-
 Germany
-
 Ghana
-
 Greece
-
 Haiti
-
 Hong Kong
-
 Hungary
-
 India
-
 Indonesia
-
 Iran, Islamic republic
-
 Iraq
-
 Ireland
-
 Israel
-
 Italy
-
 Jamaica
-
 Japan
-
 Jordan
-
 Kazakhstan
-
 Kenya
-
 Korea
-
 Kuwait
-
 Kyrgyzstan
-
 Laos
-
 Latvia
-
 Lebanon
-
 Lesotho
-
 Libya
-
 Lithuania
-
 Luxembourg
-
 Madagascar
-
 Malaysia
-
 Malta
-
 Mauritius
-
 Mexico
-
 Moldova
-
 Mongolia
-
 Montenegro
-
 Morocco
-
 Mozambique
-
 Myanmar
-
 Namibia
-
 Nepal
-
 Netherlands
-
 New Zealand
-
 Nigeria
-
 North Macedonia
-
 Norway
-
 Oman
-
 Pakistan
-
 Palestine
-
 Panama
-
 Papua New Guinea
-
 Paraguay
-
 Peru
-
 Philippines
-
 Poland
-
 Portugal
-
 Puerto Rico
-
 Qatar
-
 Reunion
-
 Romania
-
 Rwanda
-
 Saudi Arabia
-
 Serbia
-
 Singapore
-
 Slovakia
-
 Slovenia
-
 Somalia
-
 South Africa
-
 Spain
-
 Sri Lanka
-
 Sweden
-
 Switzerland
-
 Syria
-
 Taiwan
-
 Tajikistan
-
 Tanzania
-
 Thailand
-
 Trinidad and Tobago
-
 Tunisia
-
 Turkey
-
 UAE
-
 Uganda
-
 Ukraine
-
 United Kingdom
-
United States
-
 Uruguay
-
 Uzbekistan
-
 Venezuela
-
 Vietnam
-
 Yemen
-
 Zambia
-
 Zimbabwe
- Forex
- Crypto












