

Apple stock slides as CEO transition to John Ternus pressures sentiment

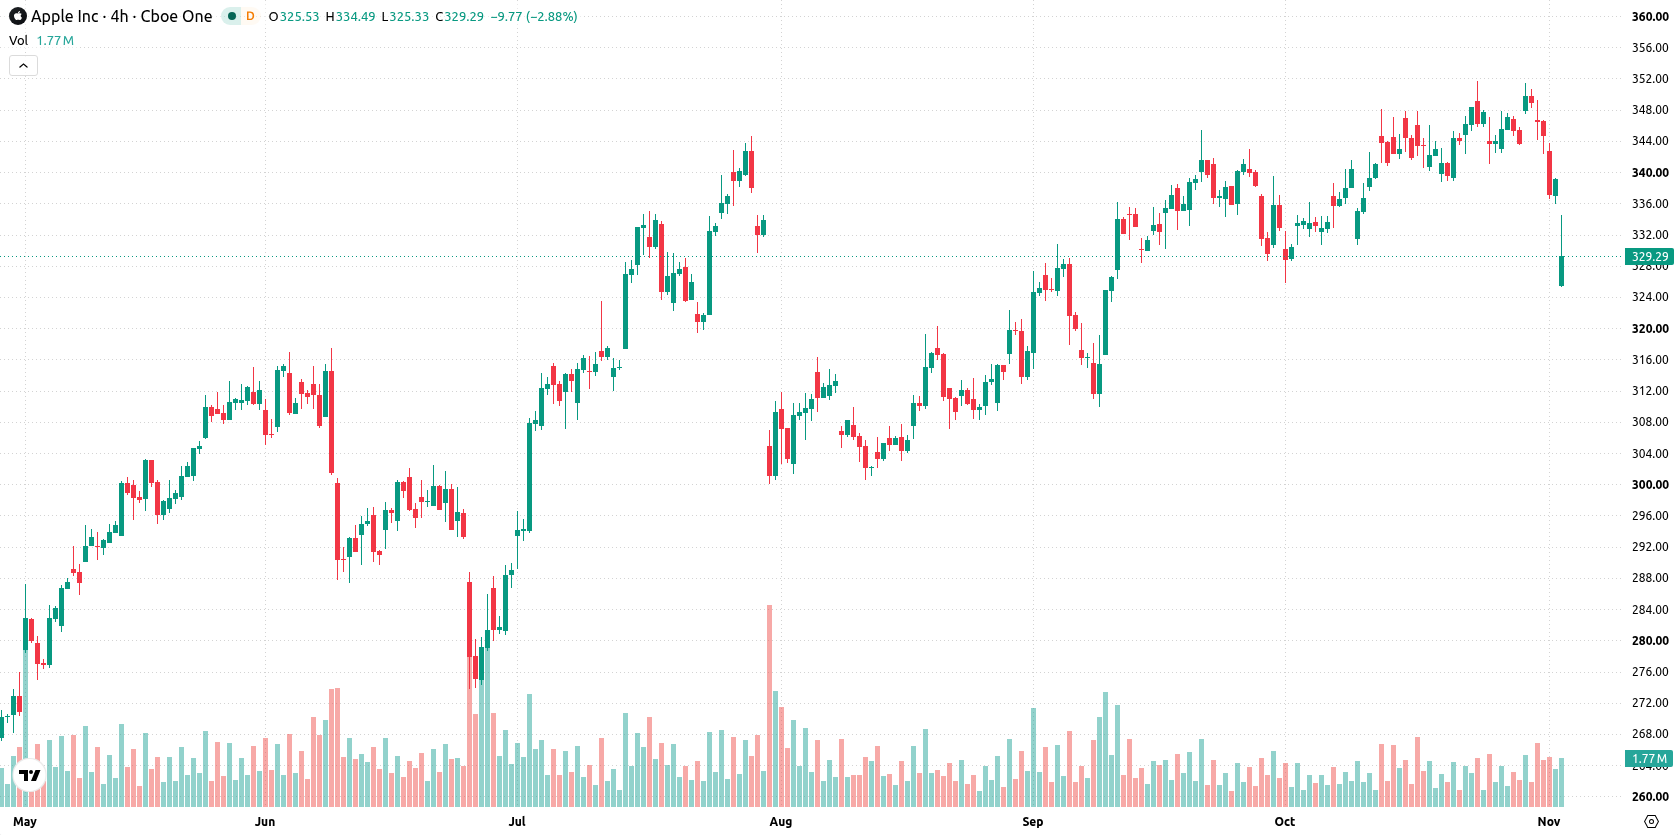
Apple Inc. (AAPL) stock is trading at $329.28, down 2.67% for the session and closing near the day’s low. The stock currently sits below its key short- and medium-term moving averages, while holding above longer-term benchmarks.
 343.80
350.58
Highlights
- Apple reported fiscal Q4 revenue of $114.5 billion and net profit of $30.7 billion, with CEO leadership changing from Tim Cook to John Ternus.
- Gross margin reached 47.9% but faced pressure from rising memory costs, and management projects a further decline to 45 to 46% for the December quarter.
- Shares of Apple closed 2.67% lower, trading below key moving averages amid strong bearish momentum and an expected two to three day range of $316.06 to $336.66.
Gross margin outlook cut as memory costs and AI investment rise
Apple reported revenue of $114.5 billion and a net profit of $30.7 billion for its fiscal fourth quarter 2026, a period that also saw the transition of CEO leadership from Tim Cook to John Ternus, according to Macrumors. The company disclosed a gross margin of 47.9% in the quarter, with one percentage point from tariff refunds, but underlying margins faced pressure from higher memory costs. Management further guided for gross margin to decline to 45–46% for the December quarter as a result of rising input costs and investments in the Siri AI rollout, as reported by Pro Thestreet.
Bearish momentum dominates as oversold signals meet resistance
On the technical front, AAPL is trading below both the MA-20 at $344.26 and MA-50 at $340.33, but remains above the MA-200 at $296.96 on the daily chart. The Ichimoku Kijun sits at $338.63, acting as immediate resistance. Among momentum indicators, MACD is neutral, whereas ADX signals a Sell bias. RSI stands in the neutral area, while Stochastic RSI and CCI are both in oversold territory, indicating possible short-term selling exhaustion. Bull/Bear Power is negative at –7.78, pointing to seller dominance within intraday trading. The Awesome Oscillator shows a strong sell, strengthening the overall bearish momentum. Despite some indicators signaling oversold conditions, the majority align with prevailing downward pressure.
Downside risk prevails as breakout levels narrow price range
Looking ahead over the next two to three trading days, the expected price range for AAPL stands between $316.06 and $336.66, reflecting the typical volatility band relative to current levels. Short-term probabilities skew 71% toward further downside with only a 29% likelihood of an upward move. The baseline scenario points to price consolidation within this corridor. A bullish breakout would require a close above resistance near $338.63, while a sustained move below $316.06 could trigger additional downside.
Previously it was reported that Apple faced ongoing margin pressures and short-term technical headwinds with downside momentum prevailing. The latest results reinforce those challenges as rising input costs and a projected margin decline underscore the importance of monitoring the $338.63 resistance level for any potential shift in price direction.











-
 Afghanistan
-
 Albania
-
 Algeria
-
 Angola
-
 Argentina
-
 Armenia
-
 Australia
-
 Austria
-
 Azerbaijan
-
 Bahamas
-
 Bahrain
-
 Bangladesh
-
 Belarus
-
 Belgium
-
 Bolivia
-
 Botswana
-
 Brazil
-
 Brunei
-
 Bulgaria
-
 Cambodia
-
 Cameroon
-
 Canada
-
 Chile
-
 China
-
 Colombia
-
 Congo
-
 Costa Rica
-
 Cote d'Ivoire
-
 Croatia
-
 Cuba
-
 Cyprus
-
 Czechia
-
 DR Congo
-
 Denmark
-
 Dominican Republic
-
 Ecuador
-
 Egypt
-
 El Salvador
-
 Estonia
-
 Eswatini
-
 Ethiopia
-
 Finland
-
 France
-
 Georgia
-
 Germany
-
 Ghana
-
 Greece
-
 Haiti
-
 Hong Kong
-
 Hungary
-
 India
-
 Indonesia
-
 Iran, Islamic republic
-
 Iraq
-
 Ireland
-
 Israel
-
 Italy
-
 Jamaica
-
 Japan
-
 Jordan
-
 Kazakhstan
-
 Kenya
-
 Korea
-
 Kuwait
-
 Kyrgyzstan
-
 Laos
-
 Latvia
-
 Lebanon
-
 Lesotho
-
 Libya
-
 Lithuania
-
 Luxembourg
-
 Madagascar
-
 Malaysia
-
 Malta
-
 Mauritius
-
 Mexico
-
 Moldova
-
 Mongolia
-
 Montenegro
-
 Morocco
-
 Mozambique
-
 Myanmar
-
 Namibia
-
 Nepal
-
 Netherlands
-
 New Zealand
-
 Nigeria
-
 North Macedonia
-
 Norway
-
 Oman
-
 Pakistan
-
 Palestine
-
 Panama
-
 Papua New Guinea
-
 Paraguay
-
 Peru
-
 Philippines
-
 Poland
-
 Portugal
-
 Puerto Rico
-
 Qatar
-
 Reunion
-
 Romania
-
 Rwanda
-
 Saudi Arabia
-
 Serbia
-
 Singapore
-
 Slovakia
-
 Slovenia
-
 Somalia
-
 South Africa
-
 Spain
-
 Sri Lanka
-
 Sweden
-
 Switzerland
-
 Syria
-
 Taiwan
-
 Tajikistan
-
 Tanzania
-
 Thailand
-
 Trinidad and Tobago
-
 Tunisia
-
 Turkey
-
 UAE
-
 Uganda
-
 Ukraine
-
 United Kingdom
-
United States
-
 Uruguay
-
 Uzbekistan
-
 Venezuela
-
 Vietnam
-
 Yemen
-
 Zambia
-
 Zimbabwe
- Forex
- Crypto












