

Will Shell stock break below support amid persistent seller pressure and technical weakness?

Shell (SHEL) stock is trading at GBX3,800, down 1.63% for the day. The price sits below its key short- and medium-term moving averages, suggesting ongoing downside relative to recent trend levels.
 3737.00
4025.00
Highlights
- Shell completed a share buyback for cancellation, reducing outstanding shares and absorbing some liquidity from the market.
- The buyback typically supports the stock in the near term, but broader selling pressure persists against Shell shares.
- Shell stock trades below key moving averages with weak momentum and is forecast to move between GBX3,678 and GBX3,922, with continued downside seen as highly probable.
Share buyback offers support as price faces ongoing selling
Shell plc completed a share buyback for cancellation on November 3, 2026, as part of its ongoing repurchase program, according to Globenewswire. The transaction reduces the total number of outstanding shares and mechanically provides some price support through liquidity absorption. While such buybacks can typically offer near-term demand for the stock, price action has remained under broader selling pressure.
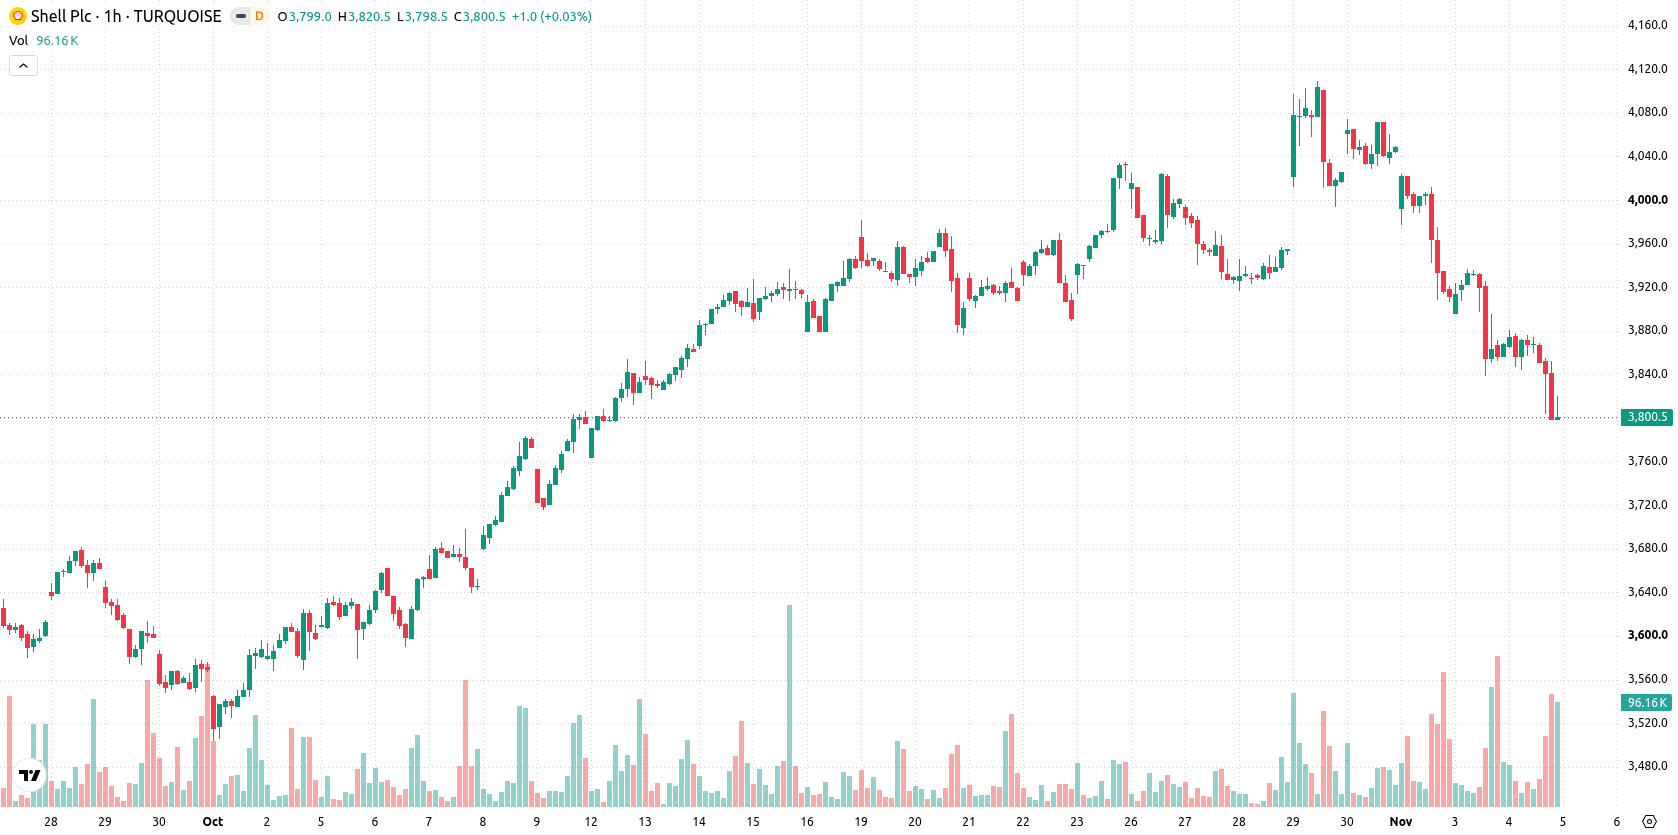
Oversold momentum builds as sellers dominate beneath resistance
Technically, SHEL is trading below the MA-20 at GBX3,875 and the MA-50 at GBX3,962 on the hourly chart, while remaining above the MA-200 at GBX3,294 on the daily timeframe. The immediate resistance is seen at the Ichimoku Kijun level of GBX3,910, with key support at GBX3,678. Both MACD and ADX continue to signal weakness, as indicated by active Sell signals. Oscillators — RSI, Stoch RSI, and CCI — are all in their respective oversold zones, suggesting the recent selloff may be reaching exhaustion. Bull/Bear Power remains negative, underscoring the dominance of sellers on the day, while the Awesome Oscillator is showing a neutral reading.
Volatility band defined as downside risk dominates short-term
In the near term, SHEL is expected to trade within a volatility band of GBX3,678 to GBX3,922 over the next two to three sessions. The likelihood of further downside is very high, with continued pressure toward lower support levels being the most probable outcome. An upside move would require a break above immediate resistance at GBX3,910, while any breach below GBX3,678 would open the door for deeper retracement. The baseline scenario anticipates price to remain rangebound in this corridor given current technical and momentum factors.
Previously it was reported that Shell shares faced persistent selling pressure, with technical indicators suggesting continued downside risks. The current analysis confirms this bearish scenario, as both recent price action and oversold oscillators reinforce the likelihood of the stock remaining rangebound, with traders advised to watch for a break above GBX3,910 or below GBX3,678 for the next directional move.










-
 Afghanistan
-
 Albania
-
 Algeria
-
 Angola
-
 Argentina
-
 Armenia
-
 Australia
-
 Austria
-
 Azerbaijan
-
 Bahamas
-
 Bahrain
-
 Bangladesh
-
 Belarus
-
 Belgium
-
 Bolivia
-
 Botswana
-
 Brazil
-
 Brunei
-
 Bulgaria
-
 Cambodia
-
 Cameroon
-
 Canada
-
 Chile
-
 China
-
 Colombia
-
 Congo
-
 Costa Rica
-
 Cote d'Ivoire
-
 Croatia
-
 Cuba
-
 Cyprus
-
 Czechia
-
 DR Congo
-
 Denmark
-
 Dominican Republic
-
 Ecuador
-
 Egypt
-
 El Salvador
-
 Estonia
-
 Eswatini
-
 Ethiopia
-
 Finland
-
 France
-
 Georgia
-
 Germany
-
 Ghana
-
 Greece
-
 Haiti
-
 Hong Kong
-
 Hungary
-
 India
-
 Indonesia
-
 Iran, Islamic republic
-
 Iraq
-
 Ireland
-
 Israel
-
 Italy
-
 Jamaica
-
 Japan
-
 Jordan
-
 Kazakhstan
-
 Kenya
-
 Korea
-
 Kuwait
-
 Kyrgyzstan
-
 Laos
-
 Latvia
-
 Lebanon
-
 Lesotho
-
 Libya
-
 Lithuania
-
 Luxembourg
-
 Madagascar
-
 Malaysia
-
 Malta
-
 Mauritius
-
 Mexico
-
 Moldova
-
 Mongolia
-
 Montenegro
-
 Morocco
-
 Mozambique
-
 Myanmar
-
 Namibia
-
 Nepal
-
 Netherlands
-
 New Zealand
-
 Nigeria
-
 North Macedonia
-
 Norway
-
 Oman
-
 Pakistan
-
 Palestine
-
 Panama
-
 Papua New Guinea
-
 Paraguay
-
 Peru
-
 Philippines
-
 Poland
-
 Portugal
-
 Puerto Rico
-
 Qatar
-
 Reunion
-
 Romania
-
 Rwanda
-
 Saudi Arabia
-
 Serbia
-
 Singapore
-
 Slovakia
-
 Slovenia
-
 Somalia
-
 South Africa
-
 Spain
-
 Sri Lanka
-
 Sweden
-
 Switzerland
-
 Syria
-
 Taiwan
-
 Tajikistan
-
 Tanzania
-
 Thailand
-
 Trinidad and Tobago
-
 Tunisia
-
 Turkey
-
 UAE
-
 Uganda
-
 Ukraine
-
 United Kingdom
-
United States
-
 Uruguay
-
 Uzbekistan
-
 Venezuela
-
 Vietnam
-
 Yemen
-
 Zambia
-
 Zimbabwe
- Forex
- Crypto












