

National Grid stock consolidates as buyers defend the 200-day moving average

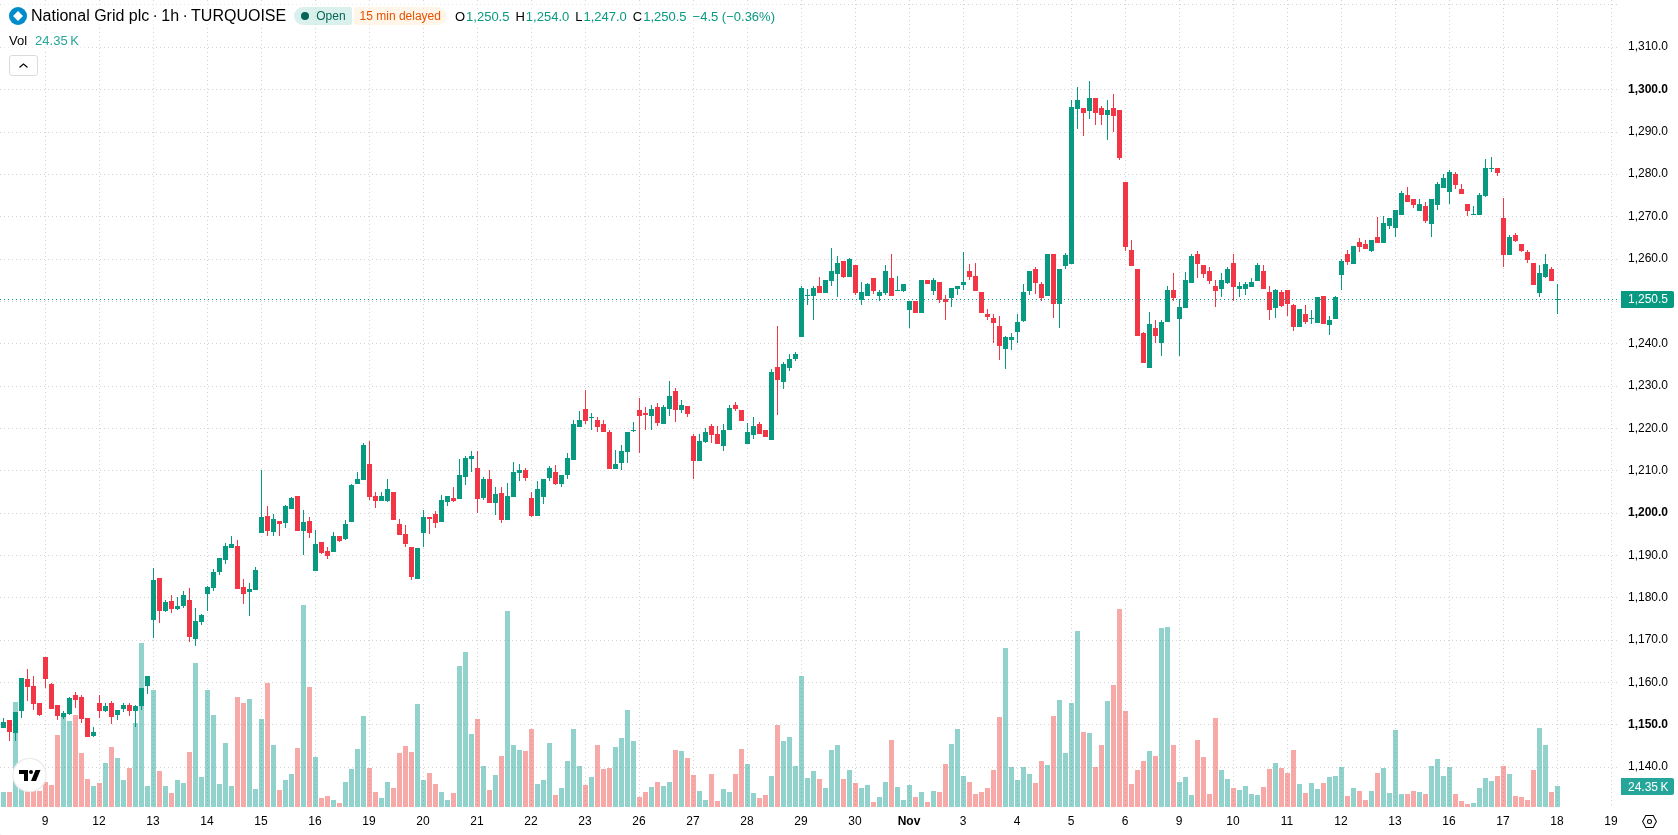
National Grid (NG) stock is trading at GBX1,247 after a modest daily decline. The price remains below its short- and medium-term moving averages but stays above the longer-term trend indicator.
 1229.50
1284.50
Highlights
- National Grid has raised its capital expenditure guidance to £70 billion, indicating an extended commitment to infrastructure investment through fiscal year 2027.
- The company expects to achieve 15 to 16% earnings per share growth by fiscal year 2027, providing multi-year visibility on targets.
- Shares of National Grid are trading with continued short- and medium-term downside pressure, forecast to move between GBX1,231 and GBX1,262, with technical indicators showing prevailing bearish momentum but oversold conditions pointing to potential short-term rebound attempts.
Capital investment drive seen as long-term catalyst with muted near-term effect
National Grid has increased its capital expenditure guidance to £70 billion while reaffirming its earnings per share growth target of 15-16% for fiscal year 2027, according to Finimize. This expanded investment plan points to a strong long-term commitment to upgrading infrastructure and supporting future business growth. While these measures provide visibility into management's strategic direction, the news is viewed by the market as a multi-year catalyst with limited impact on near-term price dynamics.
Downside momentum confirmed as sellers dominate but oscillators flag oversold
On the H1 timeframe, the price trades below the SMA-20 at GBX1,267 and the SMA-50 at GBX1,262, while staying above the D1 SMA-200 at GBX1,240. The immediate resistance is defined by the Ichimoku Kijun level at GBX1,265. Bearish momentum dominates as both MACD and ADX signal selling strength. RSI is neutral, whereas Stochastic RSI and CCI are in oversold territory. Bull/Bear Power remains negative at -6.85, confirming seller dominance for intraday trading. The Awesome Oscillator also supports the prevailing downside, but the oversold readings on CCI and Stochastic RSI highlight the potential for a short-lived rebound if oscillator exhaustion sets in.
Rangebound outlook as volatility bands limit breakout potential
Over the next several trading days, the price is expected to trade in a typical volatility band between GBX1,231 and GBX1,262. The probability of an upward breakout stands at 26%, with a 74% chance of either continued downside or rangebound action. Sideways movement within this corridor is the baseline scenario. A sustained move above resistance may lead to a recovery toward the upper end of the range, while a close below support could open the door to new lows.
Earlier, analysts noted that National Grid faced a period of technical uncertainty, with conflicting signals from momentum indicators and ongoing selling pressure shaping its near-term outlook. The current analysis reinforces this cautious stance, highlighting persistent downside risk and indicating that a decisive close below the D1 SMA-200 would serve as an important signal for heightened bearish momentum.






Latest National Grid News




-
 Afghanistan
-
 Albania
-
 Algeria
-
 Angola
-
 Argentina
-
 Armenia
-
 Australia
-
 Austria
-
 Azerbaijan
-
 Bahamas
-
 Bahrain
-
 Bangladesh
-
 Belarus
-
 Belgium
-
 Bolivia
-
 Botswana
-
 Brazil
-
 Brunei
-
 Bulgaria
-
 Cambodia
-
 Cameroon
-
 Canada
-
 Chile
-
 China
-
 Colombia
-
 Congo
-
 Costa Rica
-
 Cote d'Ivoire
-
 Croatia
-
 Cuba
-
 Cyprus
-
 Czechia
-
 DR Congo
-
 Denmark
-
 Dominican Republic
-
 Ecuador
-
 Egypt
-
 El Salvador
-
 Estonia
-
 Eswatini
-
 Ethiopia
-
 Finland
-
 France
-
 Georgia
-
 Germany
-
 Ghana
-
 Greece
-
 Haiti
-
 Hong Kong
-
 Hungary
-
 India
-
 Indonesia
-
 Iran, Islamic republic
-
 Iraq
-
 Ireland
-
 Israel
-
 Italy
-
 Jamaica
-
 Japan
-
 Jordan
-
 Kazakhstan
-
 Kenya
-
 Korea
-
 Kuwait
-
 Kyrgyzstan
-
 Laos
-
 Latvia
-
 Lebanon
-
 Lesotho
-
 Libya
-
 Lithuania
-
 Luxembourg
-
 Madagascar
-
 Malaysia
-
 Malta
-
 Mauritius
-
 Mexico
-
 Moldova
-
 Mongolia
-
 Montenegro
-
 Morocco
-
 Mozambique
-
 Myanmar
-
 Namibia
-
 Nepal
-
 Netherlands
-
 New Zealand
-
 Nigeria
-
 North Macedonia
-
 Norway
-
 Oman
-
 Pakistan
-
 Palestine
-
 Panama
-
 Papua New Guinea
-
 Paraguay
-
 Peru
-
 Philippines
-
 Poland
-
 Portugal
-
 Puerto Rico
-
 Qatar
-
 Reunion
-
 Romania
-
 Rwanda
-
 Saudi Arabia
-
 Serbia
-
 Singapore
-
 Slovakia
-
 Slovenia
-
 Somalia
-
 South Africa
-
 Spain
-
 Sri Lanka
-
 Sweden
-
 Switzerland
-
 Syria
-
 Taiwan
-
 Tajikistan
-
 Tanzania
-
 Thailand
-
 Trinidad and Tobago
-
 Tunisia
-
 Turkey
-
 UAE
-
 Uganda
-
 Ukraine
-
 United Kingdom
-
United States
-
 Uruguay
-
 Uzbekistan
-
 Venezuela
-
 Vietnam
-
 Yemen
-
 Zambia
-
 Zimbabwe
- Forex
- Crypto












