

National Grid stock outlook: Weak momentum raises risk of deeper declines

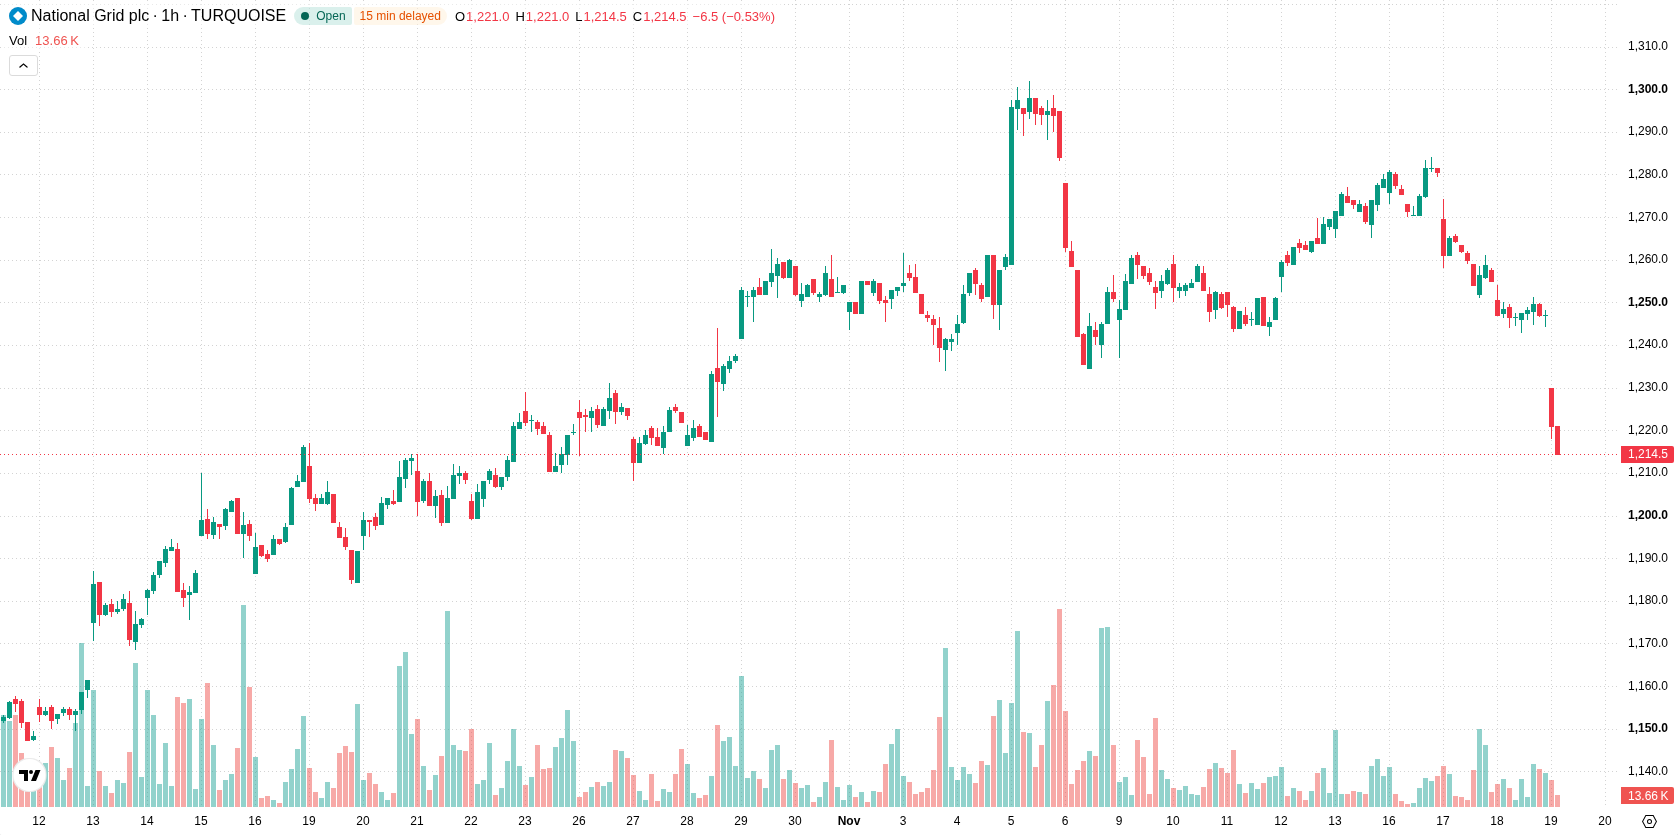
National Grid (NG) stock is trading at GBX1,215.50, down 2.53% on the day. The price remains below its key moving averages, indicating that sellers retain control in the current session.
 1229.50
1284.50
Highlights
- National Grid shareholders of record by November 20, 2026, are entitled to a $1.1433 dividend per share, payable January 12, 2027.
- Dividend eligibility depends on holding shares at the ex-dividend date, which may influence investor positioning ahead of the event.
- Shares of National Grid trade below key moving averages with technical indicators showing strong selling pressure and an expected range of GBX1,196 to GBX1,234.
Dividend timeline sets investor positioning amid lingering sell pressure
National Grid is scheduled to trade ex-dividend on November 20, 2026, with entitlement for the $1.1433 per share dividend confirmed for shareholders of record and payment set for January 12, 2027, according to News Futunn and Thecerbatgem. The announcement of this timeline defines the key date for investor positioning, as ownership on the ex-dividend date determines dividend eligibility. While the news clarifies future cash flow expectations and could shape trading behavior closer to the event, price action has remained under broader selling pressure.
Negative momentum and oversold signals as intraday sellers dominate
On the hourly chart, NG trades below the H1 SMA-20 at GBX1,250 and the H1 SMA-50 at GBX1,261, while on the daily timeframe it also sits under the D1 SMA-200 at GBX1,240. The Ichimoku Kijun at GBX1,250 serves as immediate resistance. Momentum remains negative, with both MACD and ADX signaling ongoing sell conditions. RSI, Stoch RSI, and CCI are all in oversold territory, highlighting the risk of selling exhaustion or a possible short-term rebound, though no reversal is confirmed. Bull/Bear Power is deeply negative at -22.46, confirming dominant intraday selling pressure, and the Awesome Oscillator is also aligned with continued downside.
Downside favored unless resistance is reclaimed in volatility band
In the short term, NG is expected to consolidate within the GBX1,196 to GBX1,234 range, reflecting typical volatility bands for the coming sessions. The probability of an upward move remains very low, with further declines much more likely unless buyers regain control above immediate resistance. Should price reclaim levels over resistance, an upside scenario could trigger short covering. Conversely, a loss of support at the lower end of the range would expose price to deeper declines.
Earlier, analysts noted that National Grid faced ongoing selling pressure with mixed technical signals and cautious prospects for near-term recovery. The current analysis reinforces this view, as persistent downside momentum and negative intraday signals suggest that the prevailing scenario remains bearish and traders should closely monitor for any break below the established support range.






Latest National Grid News





-
 Afghanistan
-
 Albania
-
 Algeria
-
 Angola
-
 Argentina
-
 Armenia
-
 Australia
-
 Austria
-
 Azerbaijan
-
 Bahamas
-
 Bahrain
-
 Bangladesh
-
 Belarus
-
 Belgium
-
 Bolivia
-
 Botswana
-
 Brazil
-
 Brunei
-
 Bulgaria
-
 Cambodia
-
 Cameroon
-
 Canada
-
 Chile
-
 China
-
 Colombia
-
 Congo
-
 Costa Rica
-
 Cote d'Ivoire
-
 Croatia
-
 Cuba
-
 Cyprus
-
 Czechia
-
 DR Congo
-
 Denmark
-
 Dominican Republic
-
 Ecuador
-
 Egypt
-
 El Salvador
-
 Estonia
-
 Eswatini
-
 Ethiopia
-
 Finland
-
 France
-
 Georgia
-
 Germany
-
 Ghana
-
 Greece
-
 Haiti
-
 Hong Kong
-
 Hungary
-
 India
-
 Indonesia
-
 Iran, Islamic republic
-
 Iraq
-
 Ireland
-
 Israel
-
 Italy
-
 Jamaica
-
 Japan
-
 Jordan
-
 Kazakhstan
-
 Kenya
-
 Korea
-
 Kuwait
-
 Kyrgyzstan
-
 Laos
-
 Latvia
-
 Lebanon
-
 Lesotho
-
 Libya
-
 Lithuania
-
 Luxembourg
-
 Madagascar
-
 Malaysia
-
 Malta
-
 Mauritius
-
 Mexico
-
 Moldova
-
 Mongolia
-
 Montenegro
-
 Morocco
-
 Mozambique
-
 Myanmar
-
 Namibia
-
 Nepal
-
 Netherlands
-
 New Zealand
-
 Nigeria
-
 North Macedonia
-
 Norway
-
 Oman
-
 Pakistan
-
 Palestine
-
 Panama
-
 Papua New Guinea
-
 Paraguay
-
 Peru
-
 Philippines
-
 Poland
-
 Portugal
-
 Puerto Rico
-
 Qatar
-
 Reunion
-
 Romania
-
 Rwanda
-
 Saudi Arabia
-
 Serbia
-
 Singapore
-
 Slovakia
-
 Slovenia
-
 Somalia
-
 South Africa
-
 Spain
-
 Sri Lanka
-
 Sweden
-
 Switzerland
-
 Syria
-
 Taiwan
-
 Tajikistan
-
 Tanzania
-
 Thailand
-
 Trinidad and Tobago
-
 Tunisia
-
 Turkey
-
 UAE
-
 Uganda
-
 Ukraine
-
 United Kingdom
-
United States
-
 Uruguay
-
 Uzbekistan
-
 Venezuela
-
 Vietnam
-
 Yemen
-
 Zambia
-
 Zimbabwe
- Forex
- Crypto












