

Aviva stock trades flat as weak momentum signals limit upside

Aviva (AV) stock is trading at GBX745.2 after a modest daily gain. The price remains below its short-term moving averages but is still supported by its longer-term trend.
 746.00
768.60
Highlights
- Aviva saw a rise in UK home subsidence claims after this summer's heat wave, increasing insurance liabilities.
- The growth in claims creates uncertainty for Aviva's future profitability and risk exposure as payout demands rise.
- Shares of Aviva trade below key moving averages with bearish momentum signals, seeing a forecast range of GBX732.77 to GBX757.63.
Rising subsidence claims intensify risk exposure amid payout concerns
Aviva has reported an increase in UK home subsidence claims following this summer's heat wave, which caused substantial soil drying and ground movement, according to Claimsjournal. This rise in claims highlights mounting insurance liabilities and points to potential pressure on upcoming profitability as the company manages elevated payout demands. The news creates additional uncertainty around Aviva's risk exposure, setting a cautious backdrop for the current session.
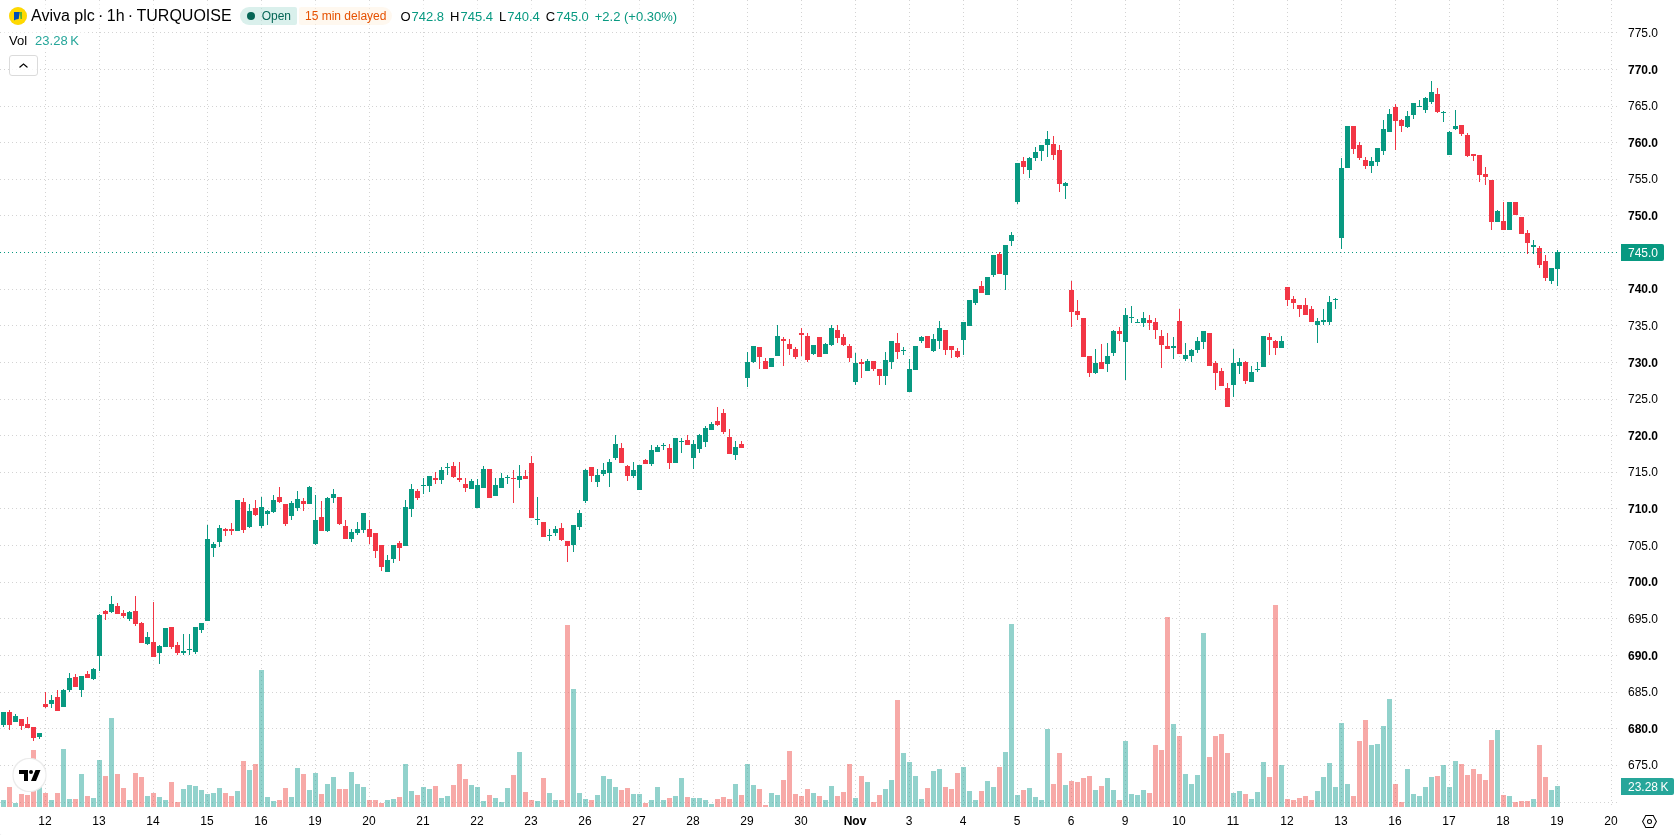
Sustained bearish momentum as mixed signals meet key resistance
On the technical side, AV is trading below the H1 SMA-20 at GBX751.89 and the H1 SMA-50 at GBX751.18, showing short-term weakness, while it remains above the D1 SMA-200 at GBX667.76, which offers long-term support. The Ichimoku Kijun at GBX754.3 acts as immediate resistance and marks a key barrier for further upward moves. Among momentum indicators, both MACD and ADX are generating Sell signals. RSI, Stoch RSI, and CCI are all neutral, and Bull/Bear Power reads -3.5, indicating seller dominance within the session. Overall, momentum signals are bearish, but neutral oscillators create mixed technical signals on short-term direction.
Balanced direction risk with volatility centered on technical levels
In the short term, AV is likely to consolidate within the forecast range of GBX732.77 to GBX757.63, reflecting typical volatility around current levels. Price action may remain range-bound unless a break occurs at key technical levels. There is a 48% probability of an upward swing and a 52% chance of a downward move, suggesting a balanced scenario with a modest risk tilt toward further declines. A close above immediate resistance could set up a bullish move, while a drop below support would reinforce bearish momentum.
Earlier, analysts noted that Aviva remained fundamentally supported but faced a mildly bearish technical outlook, with expectations for continued consolidation. The recent rise in subsidence claims now introduces additional downside risk, making the GBX732.77 technical support a key level to watch for potential bearish extension.









-
 Afghanistan
-
 Albania
-
 Algeria
-
 Angola
-
 Argentina
-
 Armenia
-
 Australia
-
 Austria
-
 Azerbaijan
-
 Bahamas
-
 Bahrain
-
 Bangladesh
-
 Belarus
-
 Belgium
-
 Bolivia
-
 Botswana
-
 Brazil
-
 Brunei
-
 Bulgaria
-
 Cambodia
-
 Cameroon
-
 Canada
-
 Chile
-
 China
-
 Colombia
-
 Congo
-
 Costa Rica
-
 Cote d'Ivoire
-
 Croatia
-
 Cuba
-
 Cyprus
-
 Czechia
-
 DR Congo
-
 Denmark
-
 Dominican Republic
-
 Ecuador
-
 Egypt
-
 El Salvador
-
 Estonia
-
 Eswatini
-
 Ethiopia
-
 Finland
-
 France
-
 Georgia
-
 Germany
-
 Ghana
-
 Greece
-
 Haiti
-
 Hong Kong
-
 Hungary
-
 India
-
 Indonesia
-
 Iran, Islamic republic
-
 Iraq
-
 Ireland
-
 Israel
-
 Italy
-
 Jamaica
-
 Japan
-
 Jordan
-
 Kazakhstan
-
 Kenya
-
 Korea
-
 Kuwait
-
 Kyrgyzstan
-
 Laos
-
 Latvia
-
 Lebanon
-
 Lesotho
-
 Libya
-
 Lithuania
-
 Luxembourg
-
 Madagascar
-
 Malaysia
-
 Malta
-
 Mauritius
-
 Mexico
-
 Moldova
-
 Mongolia
-
 Montenegro
-
 Morocco
-
 Mozambique
-
 Myanmar
-
 Namibia
-
 Nepal
-
 Netherlands
-
 New Zealand
-
 Nigeria
-
 North Macedonia
-
 Norway
-
 Oman
-
 Pakistan
-
 Palestine
-
 Panama
-
 Papua New Guinea
-
 Paraguay
-
 Peru
-
 Philippines
-
 Poland
-
 Portugal
-
 Puerto Rico
-
 Qatar
-
 Reunion
-
 Romania
-
 Rwanda
-
 Saudi Arabia
-
 Serbia
-
 Singapore
-
 Slovakia
-
 Slovenia
-
 Somalia
-
 South Africa
-
 Spain
-
 Sri Lanka
-
 Sweden
-
 Switzerland
-
 Syria
-
 Taiwan
-
 Tajikistan
-
 Tanzania
-
 Thailand
-
 Trinidad and Tobago
-
 Tunisia
-
 Turkey
-
 UAE
-
 Uganda
-
 Ukraine
-
 United Kingdom
-
United States
-
 Uruguay
-
 Uzbekistan
-
 Venezuela
-
 Vietnam
-
 Yemen
-
 Zambia
-
 Zimbabwe
- Forex
- Crypto












